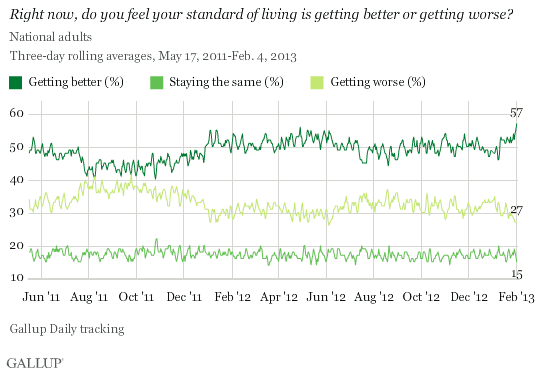
WASHINGTON, D.C. -- Fifty-seven percent of Americans say their standard of living is getting better, according to Gallup Daily tracking for the three-day period ending Feb. 4 -- tying the highest three-day reading since Gallup began tracking the question in January 2008. Twenty-seven percent say their standard of living is getting worse and 15% say it is staying the same.

Americans' optimism about their standard of living has been generally improving since the beginning of the new year. The trend also mirrors Americans' increasing economic confidence.
Separately, 75% of Americans say they are satisfied with their standard of living. This percentage has been highly stable over time, but the current reading is on the high end of what Gallup has measured over the last five years.
Young Adults, Minorities, Democrats Most Optimistic About Living Standards
Thus far in 2013, 61% of Democrats and independents who lean Democratic say their standard of living is improving. This compares with 39% of Republicans and Republican leaners. In fact, more Republicans and GOP leaners say their standard of living is getting worse (41%) than say it is getting better. Twenty-two percent of Democrats and Democratic leaners say their standard of living is getting worse. These differences are similar to what Gallup finds in terms of partisan views of the U.S. economy and satisfaction with the way things are going in the country.
Eight in 10 young adults aged 18 to 29 feel optimistic about their standard of living, by far the highest of any age group. Standard-of-living optimism declines with age: 56% of 30- to 49-year-olds see their living standards as getting better vs. 41% of 50- to 64-year-olds and 28% of those aged 65 or older. This most likely reflects the fact that for older Americans, the economics of daily life are more fixed, whereas for younger Americans, it is much more likely that their income or other aspects of their living standards will improve.

Racial and ethnic minorities are also much more optimistic about their standard of living than are whites. About seven in 10 non-Hispanic blacks, Hispanics, and Asians say their standard of living is getting better. Non-Hispanic whites, by contrast, are more split on their future prospects -- 45% believe their living standards are getting better, while 35% believe things are getting worse.
Implications
Americans are as likely now as at any time in the last five years to believe their standard of living is getting better, a positive sign that overall faith in the economy is improving. If Americans are right and their living standards are indeed on the upswing, then it is possible that consumer spending may soon follow, thereby expanding economic output. While self-reported consumer spending in January remained essentially unchanged from December, it was up from recent years' January spending. Along with January's five-year high in consumer confidence, Americans' increasing optimism about their living standards could be the precursor of a consumer spending surge, and broader economic growth, in the near future.
Survey Methods
The latest results are based on telephone interviews conducted as part of Gallup Daily tracking Feb. 1-4, 2013, with a random sample of 1,536 adults, aged 18 and older, living in all 50 U.S. states and the District of Columbia.
For results based on the total sample of national adults, one can say with 95% confidence that the maximum margin of sampling error is ±4 percentage points.
Interviews are conducted with respondents on landline telephones and cellular phones, with interviews conducted in Spanish for respondents who are primarily Spanish-speaking. Each sample of national adults includes a minimum quota of 50% cell phone respondents and 50% landline respondents, with additional minimum quotas by region. Landline telephone numbers are chosen at random among listed telephone numbers. Cell phones numbers are selected using random digit dial methods. Landline respondents are chosen at random within each household on the basis of which member had the most recent birthday.
Samples are weighted to correct for unequal selection probability, nonresponse, and double coverage of landline and cell users in the two sampling frames. They are also weighted to match the national demographics of gender, age, race, Hispanic ethnicity, education, region, population density, and phone status (cellphone only/landline only/both, cellphone mostly, and having an unlisted landline number). Demographic weighting targets are based on the March 2012 Current Population Survey figures for the aged 18 and older U.S. population. Phone status targets are based on the July-December 2011 National Health Interview Survey. Population density targets are based on the 2010 census. All reported margins of sampling error include the computed design effects for weighting.
In addition to sampling error, question wording and practical difficulties in conducting surveys can introduce error or bias into the findings of public opinion polls.
For more details on Gallup's polling methodology, visit www.gallup.com.
