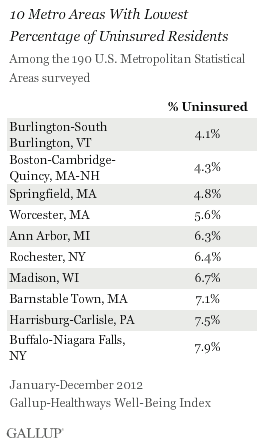
WASHINGTON, D.C. -- Nearly half of adult residents living in the McAllen-Edinburg-Mission, Texas, metro area continue to be uninsured -- about three times the national average of 16.9%. This makes it the U.S. metro area with the highest percentage of adults lacking health insurance for the second year in a row. The Burlington-South Burlington, Vt., and Boston-Cambridge-Quincy, Mass.-N.H., metro areas had the lowest uninsured rates, at 4.1% and 4.3%, respectively.


The 2012 metro area data were collected as part of the Gallup-Healthways Well-Being Index. Gallup categorizes U.S. metro areas according to the U.S. Office of Management and Budget's definition for Metropolitan Statistical Areas (MSAs) and reports on all MSAs for which there are a minimum of 300 interviews available. Each MSA sample is weighted to ensure it is demographically representative of the population of that local area.
The nationwide adult uninsured rate of 16.9% in 2012 was similar to the 17.1% in 2011, but remains up from 2008 (14.8%) and 2009 (16.2%). The metro areas with the highest and lowest uninsured rates have changed little over time.
Nationally, Gallup finds Hispanics are among the most likely demographic group to be uninsured, at 40.1%. Five of the 10 metro areas with the highest uninsured rates have a Hispanic population of 45% or more, with two metro areas in Texas -- McAllen-Edinburgh-Mission and El Paso -- at 90.6% and 82.2%, respectively, according to 2010 U.S. census data. Other metro areas with large Hispanic populations include Florida and California; eight of the 10 areas with the highest uninsured rates are in Texas, Florida, or California. This is consistent with what Gallup finds at the state level.
Bottom Line
Large discrepancies in health insurance coverage across U.S. metro areas continued in 2012. However, this could change as the centerpieces of the 2010 Affordable Care Act begin to go into effect -- health insurance exchanges and the individual mandate.
Starting Oct. 1, 2013, individuals and small businesses will be able to purchase qualified health benefit plans in a new competitive insurance marketplace. And, as of Jan. 1, 2014, all Americans will be required to carry health insurance. It remains to be seen how much this will affect the high uninsured rate in metro areas such as McAllen-Edinburg-Mission, Texas, and others.
About the Gallup-Healthways Well-Being Index
The Gallup-Healthways Well-Being Index tracks well-being in the U.S. and provides best-in-class solutions for a healthier world. To learn more, please visit well-beingindex.com.
Survey Methods
Results are based on telephone interviews conducted as part of the Gallup-Healthways Well-Being Index survey Jan. 1-Dec. 31, 2012, with a random sample of 353,564 adults, aged 18 and older, living in all 50 U.S. states and the District of Columbia, selected using random-digit-dial sampling.
For results based on the total sample of national adults, one can say with 95% confidence that the margin of sampling error is ±1 percentage point.
The margin of sampling error for most states is ±1 to ±2 percentage points, but is as high as ±4 points for states with smaller population sizes such as Alaska, Rhode Island, Vermont, Wyoming, North Dakota, South Dakota, Delaware, and Hawaii.
Interviews are conducted with respondents on landline telephones and cellular phones, with interviews conducted in Spanish for respondents who are primarily Spanish-speaking. Each sample includes a minimum quota of 400 cellphone respondents and 600 landline respondents per 1,000 national adults, with additional minimum quotas among landline respondents by region. Landline telephone numbers are chosen at random among listed telephone numbers. Cellphone numbers are selected using random-digit-dial methods. Landline respondents are chosen at random within each household on the basis of which member had the most recent birthday.
Samples are weighted by gender, age, race, Hispanic ethnicity, education, region, adults in the household, and phone status (cellphone only/landline only/both, cellphone mostly, and having an unlisted landline number). Demographic weighting targets are based on the March 2011 Current Population Survey figures for the aged 18 and older non-institutionalized population living in U.S. telephone households while MSA weighting targets are based on the 2012 Nielsen Claritas Dataset. All reported margins of sampling error include the computed design effects for weighting.
In addition to sampling error, question wording and practical difficulties in conducting surveys can introduce error or bias into the findings of public opinion polls.
For more details on Gallup's polling methodology, visit https://www.gallup.com/.
