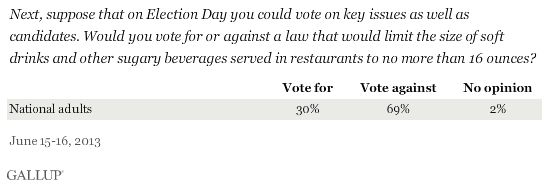
WASHINGTON, D.C. -- Americans, by 69% to 30%, say they would vote against a law that limits the size of soft drinks and other sugary beverages served in restaurants to no more than 16 ounces.

These data are from a June 15-16 Gallup poll, conducted as New York City Mayor Michael Bloomberg's administration is appealing a lower-court ruling in March that struck down his proposed 16-ounce limit on sugary beverages in the city's restaurants. The judge ruled -- a day before the ban on large soft drinks was to take effect -- that it would unfairly apply to some retailers and sugar-sweetened beverages, but not others. For example, the size limit would not apply to milk-based beverages or sugar-sweetened beverages sold in supermarkets and many convenience stores.
Bloomberg and other supporters of this proposal argue that it will help reduce diabetes and obesity rates, while critics say it represents a "nanny-state government" trying to police the choices individuals make in their everyday lives, such as what to consume in a restaurant. This proposal has generated national attention and, if it is upheld and proves to be effective in lowering obesity rates, could serve as a model for other cities and states.
Majorities in All Key Groups Are Against Sugary Drink Size Limit
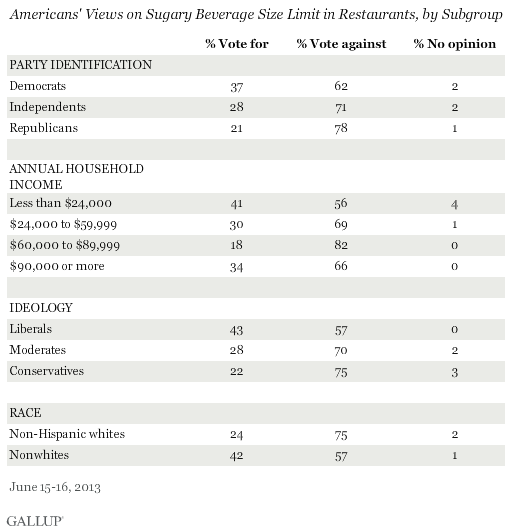
The majority of Americans across all key subgroups oppose a law that would establish a size limit on sugar-sweetened beverages served in restaurants, but there are modest differences by subgroup. Democrats are more likely than Republicans to support the size limit, 37% to 21%. This difference by party, although modest, may reflect the typical party split on the role of government, with Democrats more inclined to favor a more active government role in economic matters. Liberals are also more likely than conservatives to support this measure, 43% to 22%, while moderates' views are similar to conservatives'.
Additionally, Americans who make less than $24,000 per year and nonwhites are somewhat more likely to support such a law than their higher-income and white counterparts.

Implications
There are many possible reasons that seven in 10 Americans say they would vote against a law that would limit the size of soft drinks and other sugary beverages served in restaurants to no more than 16 ounces. To start with, soda and coffee -- two beverages that could be subject to size limits under this proposal if they are sweetened -- are very popular, with nearly half of Americans drinking soda and two-thirds drinking coffee each day.
More Americans than ever before are concerned about obesity as a serious problem to society, and a majority say it is important to have government programs that address the health risks associated with obesity. Thus, while the question on sugary drinks does not state that the purpose of this measure is to reduce obesity rates, the public may still be skeptical that this particular measure will have that effect.
Finally, Americans may think that limiting the size of beverages may be too much of a government encroachment into individual freedom, and the choice of beverage size should be left to consumers and businesses, not the government. This would be consistent with Gallup's finding that more than half of Americans still say the government is trying to do too many things that should be left to individuals and businesses.
Survey Methods
Results for this Gallup poll are based on telephone interviews conducted June 15-16, 2013, with a random sample of 1,015 adults, aged 18 and older, living in all 50 U.S. states and the District of Columbia.
For results based on the total sample of national adults, one can say with 95% confidence that the margin of sampling error is ±4 percentage points.
Interviews are conducted with respondents on landline telephones and cellular phones, with interviews conducted in Spanish for respondents who are primarily Spanish-speaking. Each sample of national adults includes a minimum quota of 50% cellphone respondents and 50% landline respondents, with additional minimum quotas by region. Landline telephone numbers are chosen at random among listed telephone numbers. Cellphone numbers are selected using random digit dial methods. Landline respondents are chosen at random within each household on the basis of which member had the most recent birthday.
Samples are weighted to correct for unequal selection probability, nonresponse, and double coverage of landline and cell users in the two sampling frames. They are also weighted to match the national demographics of gender, age, race, Hispanic ethnicity, education, region, population density, and phone status (cellphone only/landline only/both, cellphone mostly, and having an unlisted landline number). Demographic weighting targets are based on the March 2012 Current Population Survey figures for the aged 18 and older U.S. population. Phone status targets are based on the July-December 2011 National Health Interview Survey. Population density targets are based on the 2010 census. All reported margins of sampling error include the computed design effects for weighting.
In addition to sampling error, question wording and practical difficulties in conducting surveys can introduce error or bias into the findings of public opinion polls.
View methodology, full question results, and trend data.
For more details on Gallup's polling methodology, visit www.gallup.com.
