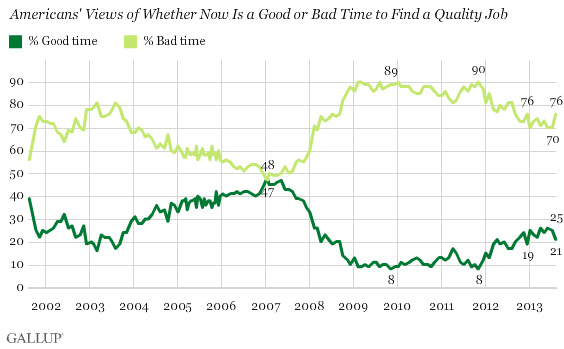
WASHINGTON, D.C. -- The market for quality jobs may be cooling. The 21% of Americans who say now is a good time to find a quality job is down from 25% in July -- and the most negative reading this year. Now, 76% say it is a bad time to find a quality job, up from 70% in July.

The Aug. 7-11 results are from Gallup's annual Work and Education poll. Gallup has been asking this question monthly since 2001, with Americans reporting the best jobs market in the first half of 2007 and the worst in 2009, 2010, and 2011 -- amid the fallout from the recent economic crisis. The low point for the measure came in November 2009 and again in November 2011, when 8% saw it as a good time to find a quality job.
Prior to this month, Americans' views of the availability of quality jobs, though still generally pessimistic, had been improving. The percentage saying now is a good time to find quality work rose through most of 2012 and increased further in 2013. But that momentum appears to be fading, which could be due to a variety of economic factors. Americans' quality jobs outlook has worsened at the same time that their confidence in the economy has declined and the U.S. Payroll to Population employment rate has been stagnant.
Survey Methods
Results for this Gallup poll are based on telephone interviews conducted Aug. 7-11, 2013, with a random sample of 2,059 adults, aged 18 and older, living in all 50 U.S. states and the District of Columbia.
For results based on the sample of 1,039 adults who are employed full- or part-time, the maximum margin of sampling error is ±4 percentage points.
Interviews are conducted with respondents on landline telephones and cellular phones, with interviews conducted in Spanish for respondents who are primarily Spanish-speaking. Each sample of national adults includes a minimum quota of 50% cellphone respondents and 50% landline respondents, with additional minimum quotas by region. Landline and cell telephone numbers are selected using random-digit-dial methods. Landline respondents are chosen at random within each household on the basis of which member had the most recent birthday.
Samples are weighted to correct for unequal selection probability, nonresponse, and double coverage of landline and cell users in the two sampling frames. They are also weighted to match the national demographics of gender, age, race, Hispanic ethnicity, education, region, population density, and phone status (cellphone only/landline only/both, and cellphone mostly). Demographic weighting targets are based on the March 2012 Current Population Survey figures for the aged 18 and older U.S. population. Phone status targets are based on the July-December 2011 National Health Interview Survey. Population density targets are based on the 2010 census. All reported margins of sampling error include the computed design effects for weighting.
In addition to sampling error, question wording and practical difficulties in conducting surveys can introduce error or bias into the findings of public opinion polls.
View methodology, full question results, and trend data.
For more details on Gallup's polling methodology, visit www.gallup.com.
