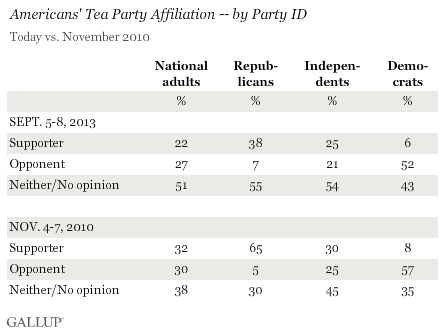
PRINCETON, NJ -- As Washington braces for another budget showdown, this time with the threat of defunding the new healthcare law in the mix, the key political force pushing for conservative policies sees diminished popular support. Fewer Americans now describe themselves as supporters of the Tea Party movement than did at the height of the movement in 2010, or even at the start of 2012. Today's 22% support nearly matches the record low found two years ago.

In November 2010, days after the Republicans recaptured the majority in the House of Representatives, 32% of Americans pledged support for the Tea Party, or 10 percentage points higher than in the latest survey, conducted Sept. 5-8.
Opponents of the Tea Party now outnumber supporters 27% to 22%, which is similar to their edge in 2012. However this differs from most of Gallup's earlier measurements, in 2010 and 2011, when supporters and opponents were either equally matched, or Tea Party backers had the slight edge.
Fully half of Americans, 51%, currently say they are neither a supporter nor an opponent of the Tea Party, or they have no opinion about it.
Strong Tea Party Opponents Outnumber Strong Supporters
In addition to their overall advantage in numbers, opponents of the Tea Party also lead supporters in intensity. The majority of Tea Party opponents call themselves strong opponents, while supporters are evenly divided as strong and not strong supporters. The net result is that 17% of Americans consider themselves strong opponents of the Tea Party, contrasted with 11% who are strong supporters, similar to the balance seen in 2011.
Tea Party Supporters Ambivalent About GOP, and Vice Versa
The poll suggests that the partnership between the Tea Party and the Republican Party may be waning. Although some of the Tea Party's most visible representatives in politics today are associated with the Republican Party, and while rank-and-file Republicans are more likely to call themselves supporters than opponents of the Tea Party movement -- a far greater number identify as neither.
To be sure, this is much more positive than Democrats' views of the Tea Party, with a majority describing themselves as opponents of the political movement. However, it is also far less supportive than three years ago, when two-thirds of Republicans identified as Tea Party supporters.

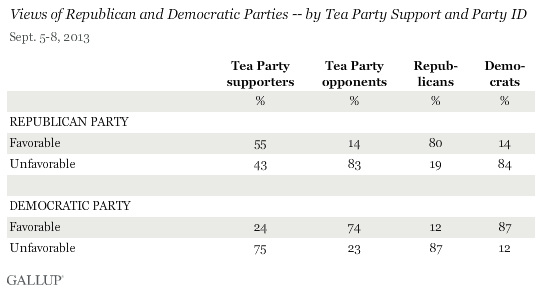
Similarly, just as Republicans are mixed in their views of the Tea Party, Tea Party supporters themselves have mixed views about the Republican Party: 55% hold a favorable view of it and 43% an unfavorable view. This contrasts with the highly positive views toward the GOP expressed by Republicans, with 79% rating it favorably, and 19% unfavorably. Tea Party supporters and Republicans are aligned however, in their broadly unfavorable reaction to the Democratic Party.

Bottom Line
U.S. support for the Tea Party is at a low ebb at a time when key issues of concern for the movement -- funding for the Affordable Care Act and raising the U.S. debt ceiling -- are focal points in Washington, with Tea Party-backed Sen. Ted Cruz prominently fighting both policies. The discomfort he has created in the Republican caucus is merely emblematic of the ambivalence national Republicans feel toward the movement. Although few Republicans outright oppose the Tea Party, far more are neutral toward it than support it.
Notably, while Tea Party supporters and activists may not be fully satisfied with the GOP, they feel just as negatively as Republicans do about the Democratic Party, indicating they have little alternative in national elections. However, their frustration with the GOP could result in more Tea Party-backed conservative challenges to Republican incumbents who don't embrace Tea Party principles.
Survey Methods
Results for this Gallup poll are based on telephone interviews conducted Sept. 5-8, 2013, with a random sample of 1,510 adults, aged 18 and older, living in all 50 U.S. states and the District of Columbia.
For results based on the total sample of national adults, one can say with 95% confidence that the margin of sampling error is ±3 percentage points.
Interviews are conducted with respondents on landline telephones and cellular phones, with interviews conducted in Spanish for respondents who are primarily Spanish-speaking. Each sample of national adults includes a minimum quota of 50% cellphone respondents and 50% landline respondents, with additional minimum quotas by region. Landline and cell telephone numbers are selected using random-digit-dial methods. Landline respondents are chosen at random within each household on the basis of which member had the most recent birthday.
Samples are weighted to correct for unequal selection probability, nonresponse, and double coverage of landline and cell users in the two sampling frames. They are also weighted to match the national demographics of gender, age, race, Hispanic ethnicity, education, region, population density, and phone status (cellphone only/landline only/both, and cellphone mostly). Demographic weighting targets are based on the March 2012 Current Population Survey figures for the aged 18 and older U.S. population. Phone status targets are based on the July-December 2011 National Health Interview Survey. Population density targets are based on the 2010 census. All reported margins of sampling error include the computed design effects for weighting.
In addition to sampling error, question wording and practical difficulties in conducting surveys can introduce error or bias into the findings of public opinion polls.
For more details on Gallup's polling methodology, visit www.gallup.com.
