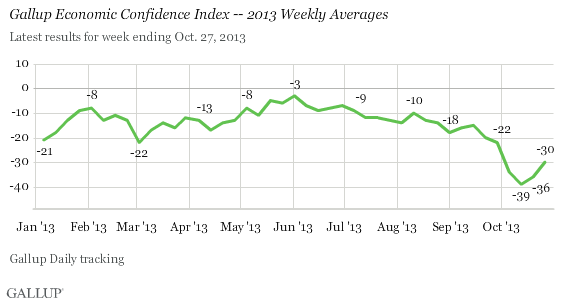
PRINCETON, NJ -- The Gallup Economic Confidence Index rose six points last week to -30. While this marks the second straight week of improvement since the end of the federal government shutdown, confidence is still well below the -15 reading Gallup found in mid-September, in the weeks before the shutdown. It remains sharply lower than the -3 reached earlier this year.

The latest results are for the week ending Oct. 27, based on interviews with more than 3,500 U.S. adults. The index represents Americans' net optimism about the economy, combining their views about current economic conditions and their perceptions of the economy's direction. The index has a theoretical maximum of +100 if all Americans think the economy is "excellent" or "good" and improving, and a theoretical minimum of -100 if all believe the economy is "only fair" or "poor" and getting worse.
Economic Optimism Hurt Most by the Showdown-Shutdown Saga
The Economic Confidence Index began slipping in the second half of September, as partisan disagreement over the budget intensified, and then plunged after Oct. 1, once the shutdown occurred. Since the government reopened on Oct. 17, confidence has only partially recovered, improving six points last week on top of three points the week before.
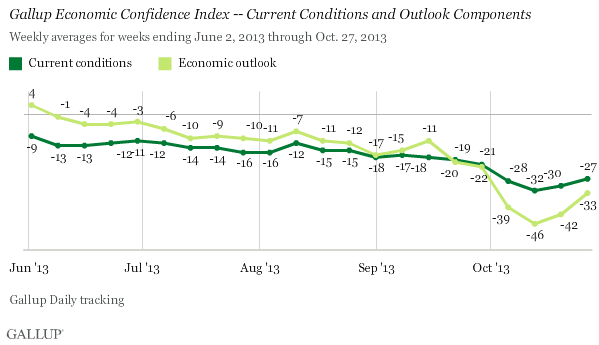
The biggest shifts across this entire period were in Americans' economic outlook -- suggesting Americans expected the shutdown to have a negative ripple effect on the economy, rather than creating immediate hardship.
Now, with confidence rebounding, most of the improvement has come from gains in the outlook component, at -33 last week, up 13 points from -46 in mid-October. Currently, 31% of Americans say the economy is improving and 64% say it is getting worse.
Views on current economic conditions stand at -27, with 16% rating the economy as excellent or good and 43% calling it poor. This is up five points from October's low.

Bottom Line
The recent congressional battle over funding the federal government and raising the federal debt ceiling severely rattled Americans' confidence in the economy's direction as the political showdown turned to a shutdown, renewing bleak talk of another hit to the nation's credit rating. Confidence was at its lowest in the first half of October. It has since recovered some, and given the greater improvement seen last week compared with the week before, that recovery may be accelerating. However, there is a distance to go even to return to the levels seen in early September, much less the nearly positive levels recorded back in June. In previous government budgetary crises -- such as after this year's budget sequestration and the 2011 debt ceiling crisis -- confidence rebounded within weeks or months.
The Conference Board's October Consumer Confidence Index, to be reported Tuesday morning, is likely to be down sharply from September, possibly by more than the five points analysts expect. However, because that index is heavily weighted toward surveys collected at the beginning of the month, the magnitude of its October decline could overstate matters, as it will not reflect the improvements in confidence that occurred in the second half of the month. Confidence is clearly down compared with September, but perhaps the more important point is that the direction of consumer trends can change quickly, and confidence is already in a fragile recovery.
Survey Methods
Results for this Gallup poll are based on telephone interviews conducted Oct. 21-27, 2013, with a random sample of 3,574 adults, aged 18 and older, living in all 50 U.S. states and the District of Columbia.
For results based on the total sample of national adults, one can say with 95% confidence that the margin of sampling error is ±3 percentage points.
Interviews are conducted with respondents on landline telephones and cellular phones, with interviews conducted in Spanish for respondents who are primarily Spanish-speaking. Each sample of national adults includes a minimum quota of 50% cellphone respondents and 50% landline respondents, with additional minimum quotas by region. Landline and cell telephone numbers are selected using random-digit-dial methods. Landline respondents are chosen at random within each household on the basis of which member had the most recent birthday.
Samples are weighted to correct for unequal selection probability, nonresponse, and double coverage of landline and cell users in the two sampling frames. They are also weighted to match the national demographics of gender, age, race, Hispanic ethnicity, education, region, population density, and phone status (cellphone only/landline only/both, and cellphone mostly). Demographic weighting targets are based on the March 2012 Current Population Survey figures for the aged 18 and older U.S. population. Phone status targets are based on the July-December 2011 National Health Interview Survey. Population density targets are based on the 2010 census. All reported margins of sampling error include the computed design effects for weighting.
In addition to sampling error, question wording and practical difficulties in conducting surveys can introduce error or bias into the findings of public opinion polls.
For more details on Gallup's polling methodology, visit www.gallup.com.
