WASHINGTON, D.C. -- Americans' satisfaction with the future facing themselves and their families, as well as their present-day family or household income, has returned to levels seen 50 years ago. Yet their satisfaction with their housing situation has improved.

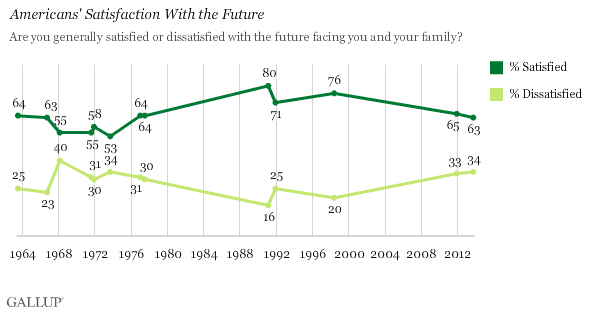
The 63% of Americans who today are satisfied with the future facing them and their families, based on Sept. 21-24 polling, is just one percentage point lower than Gallup found when it asked the same question for the first time, in July 1963. Americans were most likely to be satisfied (80%) near the end of the first Gulf War, in February 1991. Through the rest of the 1990s, Americans' satisfaction remained in the 70% range, before falling to 65% in 2011 amid a slow recovery from the recession. Gallup did not ask this question in the first decade of the new century.
Americans were feeling least optimistic about the future in the late 1960s and early 1970s, culminating in the September 1973 reading (53% satisfied) -- as the U.S. stock market was in the middle of a steep decline, inflation was heating up, and the White House was embroiled in the Watergate scandal. After that low point, satisfaction rose in the late 1970s to levels similar to those seen in 2013.
Satisfaction With Family Income Also Similar to 1963 Levels
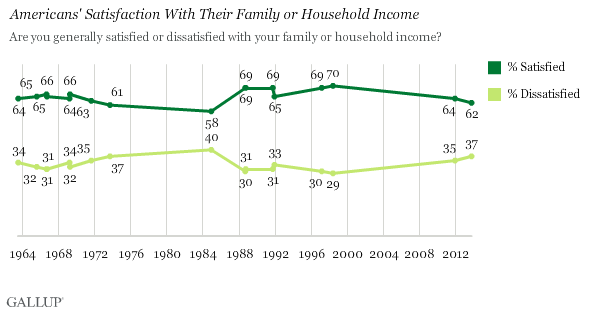
Americans are as satisfied now with their present family or household income as they were 50 years ago. Today, 62% say they are satisfied, and in 1963, 64% felt the same way. The current reading marks a decline from the high of 70% in 1998, during a strong economy largely fueled by the dot-com boom. Americans were least likely to be satisfied with their household income (58%) in December 1984, as the U.S. was entering a great expansion in GDP that would last about 25 years. By 1988, satisfaction with family income had risen to 69%.

Americans Remain Highly Satisfied With Their Housing Situation
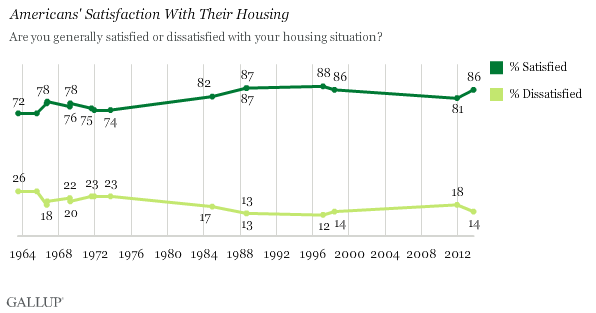
Unlike their feelings about the future and their household income, Americans' satisfaction with their housing situation is much higher than it was 50 years ago. Currently, 86% of Americans are satisfied with their housing, while 72% were satisfied in 1963 -- tied for the lowest reading on record. This figure peaked in the winter of 1997, but was only two points higher than it is now, at 88%.

Bottom Line
Americans' satisfaction in three key areas -- their future prospects, their family or household income, and their housing -- have varied over time. In the first two of these, Americans' satisfaction levels after a relatively brief spike have returned to where they were in 1963, a much different time in the U.S. The drop in these areas from their peaks in the 1980s and 1990s suggests that after a period of record economic prosperity in the U.S., Americans' feelings are now more aligned with a time before this mammoth economic expansion. Perhaps, to paraphrase what Alan Greenspan once said, the age of "irrational exuberance" is indeed over.
Housing, however, is a different story. A likely interpretation of the question about "your housing situation" is "the house you live in now," meaning Americans' satisfaction with the rooms in their house, the furnishings, yard, and so on. It may be less likely that Americans are responding based on the value of their house, which has likely varied a lot in the last 20 years, especially after the housing bubble burst in the late 2000s. But also, home values, even if they are fluctuating, really become relevant only if an owner is looking to sell his or her home. Americans' satisfaction with their housing, consistently more than 80% since 1984, has proved remarkably resilient.
Survey Methods
Results for this Gallup poll are based on telephone interviews conducted Sept. 21-24, 2013, on the Gallup Daily tracking survey, with a random sample of 2,031 adults, aged 18 and older, living in all 50 U.S. states and the District of Columbia.
For results based on the total sample of national adults, one can say with 95% confidence that the margin of sampling error is ±3 percentage points.
Interviews are conducted with respondents on landline telephones and cellular phones, with interviews conducted in Spanish for respondents who are primarily Spanish-speaking. Each sample of national adults includes a minimum quota of 50% cellphone respondents and 50% landline respondents, with additional minimum quotas by region. Landline and cell telephone numbers are selected using random-digit-dial methods. Landline respondents are chosen at random within each household on the basis of which member had the most recent birthday.
Samples are weighted to correct for unequal selection probability, nonresponse, and double coverage of landline and cell users in the two sampling frames. They are also weighted to match the national demographics of gender, age, race, Hispanic ethnicity, education, region, population density, and phone status (cellphone only/landline only/both, and cellphone mostly). Demographic weighting targets are based on the March 2012 Current Population Survey figures for the aged 18 and older U.S. population. Phone status targets are based on the July-December 2011 National Health Interview Survey. Population density targets are based on the 2010 census. All reported margins of sampling error include the computed design effects for weighting.
In addition to sampling error, question wording and practical difficulties in conducting surveys can introduce error or bias into the findings of public opinion polls.
For more details on Gallup's polling methodology, visit www.gallup.com.
