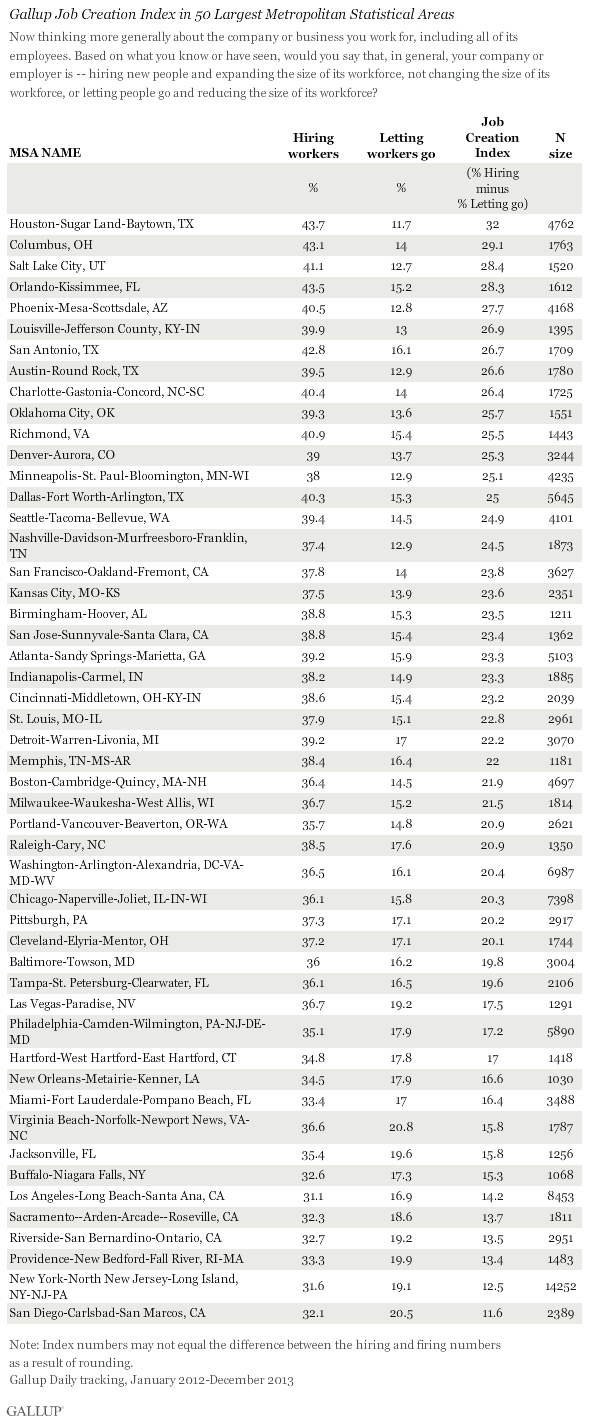
WASHINGTON, D.C. -- Among the nation's 50 largest U.S. metropolitan areas, Houston ranks as the best environment for job creation and San Diego ranks as the worst, based on reports of hiring activity versus layoffs from workers who live in those areas.
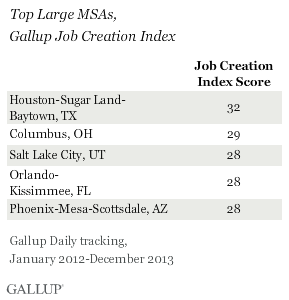
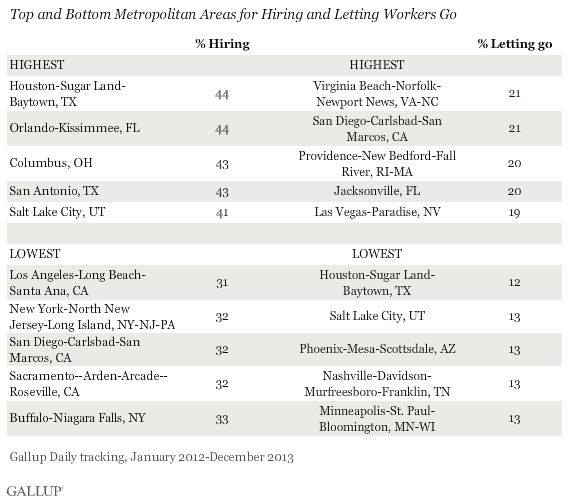
Gallup's Job Creation Index score is based on the percentage of workers who say their employer is hiring and expanding its workforce versus the percentage saying their employer is letting people go and reducing its workforce. Houston's top score of +32 on the index is based on 44% of Houston-area workers saying their employer was hiring and expanding versus 12% saying their employer was letting people go and reducing in 2012-2013.
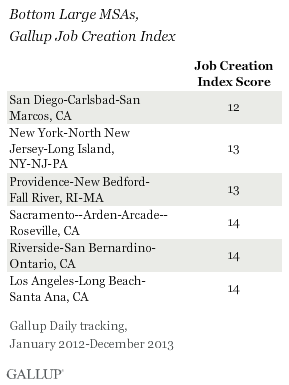
San Diego, at the bottom of the list, had 32% of its workforce saying companies are hiring and 20% saying companies are letting people go.
These results are based on Gallup Daily tracking conducted throughout 2012-2013 in the 50 most populous metropolitan statistical areas (MSAs). Gallup interviewed at least 1,000 working adults in each of these MSAs, with as many as 14,252 in the New York City metro area. Each MSA sample is weighted to match the demographic characteristics of that area. Gallup previously conducted an analysis examining the 2012 data alone. Because of changes in interviewing in 2013, the 2012 and 2013 data are reported together to have large enough samples to report updated figures for each MSA.
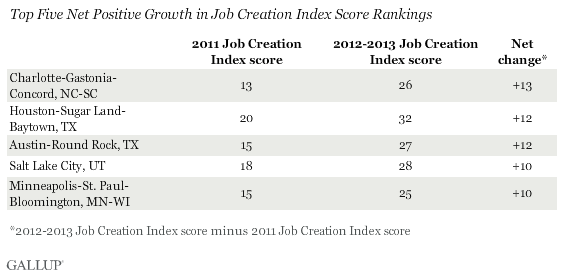
Houston climbed to the top of the Job Creation Index list after being just outside the top five in 2011, displacing Oklahoma City. While Houston's progress on this front is notable, Charlotte, N.C., had nominally the highest overall change in its index score, from 13 in 2011 to 26 in 2012-2013. Other cities that saw similar improvements include Austin, Texas, Salt Lake City, and Minneapolis.
An increase in reported hiring fueled Houston's ascent to the top of the Job Creation Index rankings in 2012-2013, with 44% of Houston-area workers saying companies in the area are hiring, up from 39% in 2011. Houston's hiring percentage ties with Orlando, Fla., as the nation's highest; Los Angeles is at the bottom of the list, at 31%. The reason Houston tops Orlando in the overall ranking is that fewer workers in Houston reported layoffs, at 12%, and a higher 15% of Orlando-based workers said the company or employer they work for is letting people go.
Bottom Line
In general, metro areas in Texas proved able in terms of creating jobs, with large cities such as San Antonio and Austin making the top 10 list of MSAs with the highest Job Creation Index scores. California, on the other hand, saw several of its cities ranked toward the bottom, with San Diego last on the list.
But there is room for cheer for residents living in all of these 50 metro areas because the Job Creation Index was still in positive territory in 2012-2013, meaning all of these important population centers were, generally speaking, hiring. Given the considerable size of these 50 metro areas, this uniform net hiring is also a good thing for the U.S. economy overall.
Survey Methods
Results are based on telephone interviews conducted as a part of Gallup Daily tracking Jan. 1, 2012-Dec. 3, 2013, with a random sample of 150,521 adults, aged 18 and older, employed full or part time, living in the 50 largest metropolitan statistical areas (MSAs) by population.
Margins of error for individual MSAs are no greater than ±4 percentage points and are ±3 percentage points in most MSAs.
Interviews are conducted with respondents on landline telephones and cellular phones, with interviews conducted in Spanish for respondents who are primarily Spanish-speaking. Each sample of national adults includes a minimum quota of 50% cellphone respondents and 50% landline respondents, with additional minimum quotas by time zone within region. Landline and cellular telephone numbers are selected using random-digit-dial methods. Landline respondents are chosen at random within each household on the basis of which member had the most recent birthday.
Samples are weighted to correct for unequal selection probability, nonresponse, and double coverage of landline and cell users in the two sampling frames. Samples are weighted to match MSA demographics of gender, age, race, Hispanic ethnicity, education and phone status (cellphone only/landline only/both, and cellphone mostly). Demographic weighting targets are based on the most recent Nielsen demographic estimates for the aged 18 and older population in each MSA. Phone status targets are based on the most recent National Health Interview Survey. All reported margins of sampling error include the computed design effects for weighting.
In addition to sampling error, question wording and practical difficulties in conducting surveys can introduce error or bias into the findings of public opinion polls.
For more details on Gallup's polling methodology, visit www.gallup.com.
