This article is part of a weeklong series analyzing how education leaders, students, and teachers evaluate education in America. The series will feature Americans' opinions on topics such as the Common Core, a uniform set of academic skills and competencies in U.S. schools; the quality of public K-12 education; the level of respect for U.S. teachers; and the viability of online higher education.
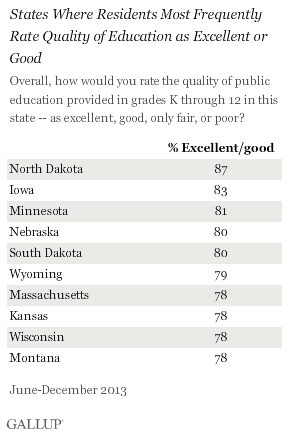
WASHINGTON, D.C. -- Nearly nine in 10 North Dakotans rate the quality of their state's public K-12 education as excellent or good -- the highest ratings nationwide. Public school systems in Iowa, Minnesota, Nebraska, and South Dakota trail behind North Dakota closely, with at least 80% of residents rating their states' schools this highly.
The results are based on a special 50-state Gallup poll conducted June-December 2013, including interviews with at least 600 residents in every state. This poll allows Gallup for the first time to report Americans' perceptions of schools at the state level.
North Dakota has topped several of Gallup's recent state-by-state measures, including well-being, trust in state government, and job creation, to name a few. The state's strong performance on these and other measures is largely fueled by its newfound oil wealth and resulting economic boom, which also helped to fund record school spending in 2013. Residents' positive perceptions about school quality may reflect this investment in education as well as a general sense of optimism about the state's overall direction.
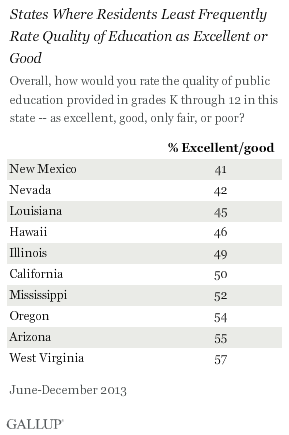
More than 1,000 miles to the south and west, half as many residents in Nevada (42%) and New Mexico (41%) rate their public schools as excellent or good, the lowest scores in the U.S. However, residents in Illinois, Hawaii, and Louisiana took a similarly dim view of their own schools, with less than 50% ranking them as excellent or good.
Respondents likely consider several factors when rating school quality in their states, including student outcomes. U.S. Department of Education data for 2010-2011 show that while eight of the top states in Gallup's measure had graduation rates of 80% or higher, four of the lowest-ranking schools in Gallup's measure -- New Mexico, Nevada, Louisiana, and Oregon -- fell into the bottom 20% of states with the lowest graduation rates in the U.S.
States With Top School Quality Ratings Also Highest in Preparing Pupils for Work
Residents in states that gave the highest rankings to the quality of their public schools were also the most likely to say these schools are preparing students for success in the workplace. Though in a slightly different order than they appeared in the quality rankings, each of the same top states received a 70% or higher rating on the student preparation question. The consistency in ratings of quality and student workforce preparedness suggests that residents may equate a quality education with one that prepares young people well for the workforce.
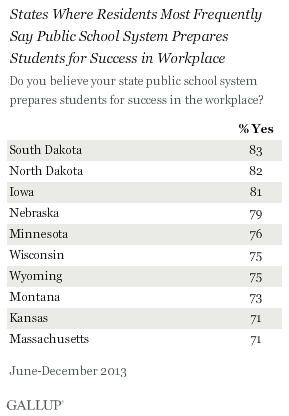
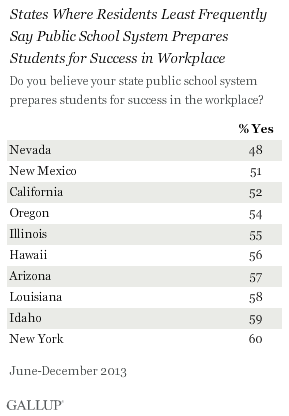
In five of the states dominating the top quality and student preparedness rankings, including both Dakotas, Iowa, Nebraska, and Wyoming, unemployment rates in 2013 were under 5% -- some of the lowest seen in the U.S. Residents in these states might be more likely to see students as prepared for success in the workplace because people in general have a relatively easier time finding employment in these job markets. By contrast, five of the bottom-ranking states had unemployment rates of 7% or higher.
Bottom Line
The different ratings of school quality across the U.S. may reflect, in part, the varying economic realities of each state. Because this is the first time Gallup has measured these data, it is not known how ratings of education by state were affected by the economic downturn and improving economy since then. But with most of K-12 education dollars coming from local and state budgets, spending on public schools is largely tethered to a state's economic highs and lows. Therefore it is likely that states in good economic shape can afford to spend more to keep class sizes small, attract talented teachers with better pay, and maintain and improve their facilities, while schools in struggling state economies contend with overcrowded classrooms and deteriorating infrastructure, conditions that could lead to lower perceptions of quality.
Still, funding is just one of many interconnecting elements that combine to make a school system successful. Residents of the group of states appearing at the top of both of Gallup's rankings seem to feel that their schools have found a winning formula of providing a quality education that prepares students for a successful career. As leaders struggle to come up with ways to make the nation's education system more competitive on a global stage, a closer look at the schools that top Gallup's quality and preparedness rankings may yield insights and best practices that other states can adopt to boost their own performance.
Survey Methods
Results for this Gallup poll are based on telephone interviews conducted June-December 2013, with a random sample of approximately 600 adults, aged 18 and older, living in all 50 U.S. states.
For results based on the total sample of adults per state, the margin of sampling error is ±5 percentage points at the 95% confidence level.
Interviews are conducted with respondents on landline telephones and cellular phones, with interviews conducted in Spanish for respondents who are primarily Spanish-speaking. Each sample of national adults includes minimum quotas of cellphone respondents and landline respondents based on cellphone and landline use in the respective state. Landline and cellular telephone numbers are selected using random-digit-dial methods. Landline respondents are chosen at random within each household on the basis of which member had the most recent birthday.
Samples are weighted to correct for unequal selection probability, nonresponse, and double coverage of landline and cell users in the two sampling frames. They are also weighted to match the state demographics of gender, age, race, Hispanic ethnicity, education, region, population density, and phone status (cellphone only/landline only/both, and cellphone mostly). Demographic weighting targets are based on the most recent Current Population Survey figures for the aged 18 and older U.S. population. Phone status targets are based on the most recent National Health Interview Survey. Population density targets are based on the most recent U.S. census. All reported margins of sampling error include the computed design effects for weighting.
In addition to sampling error, question wording and practical difficulties in conducting surveys can introduce error or bias into the findings of public opinion polls.
For more details on Gallup's polling methodology, visit www.gallup.com.
