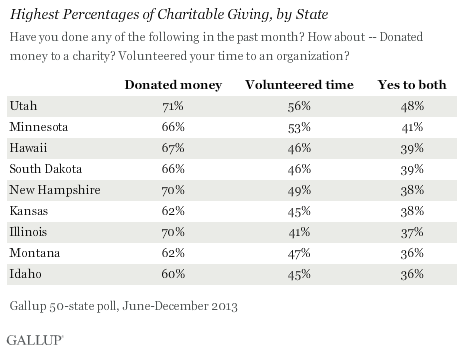
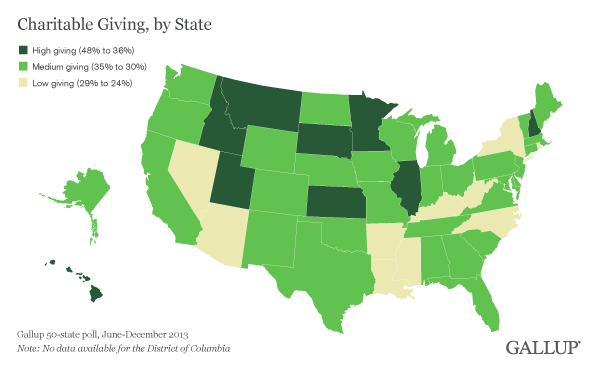
WASHINGTON, D.C. -- Utah leads U.S. states in reported charitable giving, with nearly half of its residents saying they had donated money and volunteered their time to an organization in the previous month. Residents in several Southern and Southwestern states -- as well as New York -- were among the least likely to say they did both.
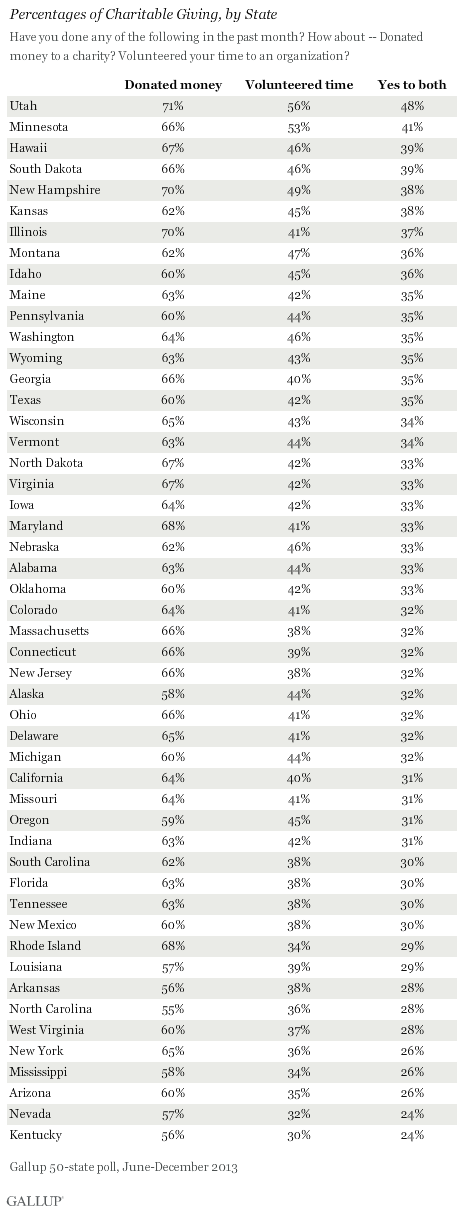
These data come from a 50-state Gallup poll conducted June-December 2013, with at least 600 residents in each state. Gallup asked Americans whether they personally had donated money to charity or volunteered time to an organization in the previous month. The full results for each state are shown on page 2.
Overall, residents in all states were more likely to donate their money than their time, which is consistent with what Gallup has previously observed at the national and global levels. Utah and Minnesota are the only states where majorities of residents say they have done each in the past month.
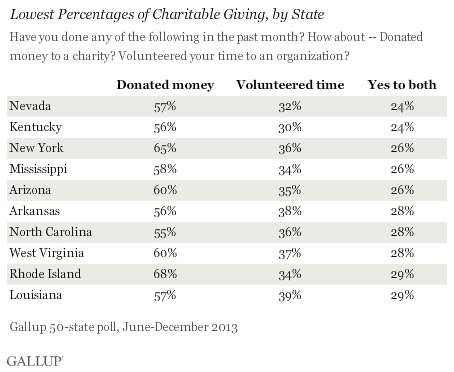
The percentage of those donating money and volunteering time was below 30% in 10 states -- Nevada, Kentucky, New York, Mississippi, Arizona, Arkansas, North Carolina, West Virginia, Rhode Island, and Louisiana. New York and Rhode Island residents ranked fairly high on donating their money, but fell behind in volunteering their time.
Link Between a State's Charitable Giving and Its Well-Being
Gallup has found that people with higher well-being are more likely to give back to their communities -- whether it be their time, money, or help to strangers -- and this relationship is true as well for states with lower well-being scores.
States with the lowest charitable giving percentages also had generally lower Gallup-Healthways well-being scores than states with higher giving averages. Of the most charitable states, all were above the national average for well-being; whereas only two of the least charitable states -- Arizona and Nevada -- were above the national average.
Bottom Line
While certain states outshine others in giving back to their communities, Americans as a whole do show impressive figures for their acts of kindness compared with the rest of the world. Although it is possible that giving to others helps foster higher well-being in the individuals taking part in those kinds of activities, it is also possible that citizens with higher well-being are more likely to become active in their communities. Thus, by supporting their residents' well-being, state and local leaders could help communities reap a dividend in greater civic involvement.
Survey Methods
Results for this Gallup poll are based on telephone interviews conducted June-December 2013, with a random sample of approximately 600 adults per state, aged 18 and older, living in all 50 U.S. states.
For results based on the total sample of adults per state, the margin of sampling error is ±5 percentage points at the 95% confidence level.
Interviews are conducted with respondents on landline telephones and cellular phones, with interviews conducted in Spanish for respondents who are primarily Spanish-speaking. Each sample of national adults includes minimum quotas of cellphone respondents and landline respondents based on cellphone and landline use in the respective state. Landline and cellular telephone numbers are selected using random-digit-dial methods. Landline respondents are chosen at random within each household on the basis of which member had the most recent birthday.
Samples are weighted to correct for unequal selection probability, nonresponse, and double coverage of landline and cell users in the two sampling frames. They are also weighted to match the state demographics of gender, age, race, Hispanic ethnicity, education, region, population density, and phone status (cellphone only/landline only/both, and cellphone mostly). Demographic weighting targets are based on the most recent Current Population Survey figures for the aged 18 and older U.S. population. Phone status targets are based on the most recent National Health Interview Survey. Population density targets are based on the most recent U.S. census. All reported margins of sampling error include the computed design effects for weighting.
In addition to sampling error, question wording and practical difficulties in conducting surveys can introduce error or bias into the findings of public opinion polls.
For more details on Gallup's polling methodology, visit www.gallup.com.