WASHINGTON, D.C. -- Americans view the Democratic Party more favorably than the Republican Party, even though both parties have a net unfavorable rating. Democratic Party favorable ratings have held steady since last June, while Republican favorables have increased slightly from their all-time low last year. Still, if the Republicans' current favorability ratings hold, they will be the lowest ever for either party in an election year.
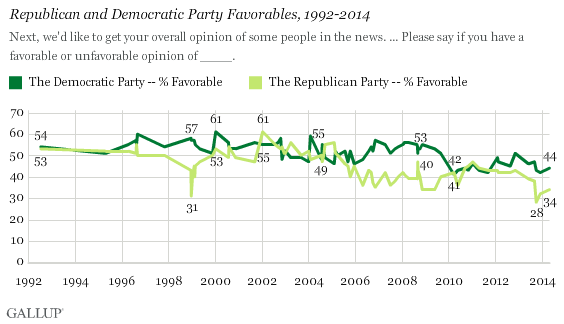
These ratings are based on a Gallup poll conducted April 24-30, 2014, in which the Democratic Party had a favorable rating of 44%, compared with 34% favorable for the Republican Party. Views of both parties have not changed markedly from the last update in December 2013, and the Republican Party's favorability has improved only modestly from the all-time low of 28% observed during the October government shutdown.
Overall, the GOP has a net favorability rating of -25 (34% favorable and 59% unfavorable), and this score has been negative since April 2011, averaging -15 percentage points. More broadly, the GOP has suffered from mostly negative or low positive scores since October 2005, about a year into President George W. Bush's second term, when his approval rating began to sink. The GOP boasted mostly positive net favorable scores prior to that, except for late 1998 and early 1999 during the Clinton impeachment vote and subsequent Senate trial.
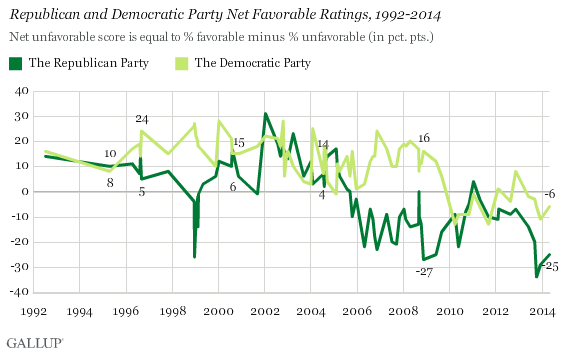
The Democrats' net favorable rating stands at -6 (44% favorable and 50% unfavorable), marking the fifth consecutive poll, dating to June 2013, in which Americans have viewed this party more unfavorably than favorably. The Democrats' net favorable rating throughout Barack Obama's presidency has alternated between episodes of positivity, such as in 2009 and in late 2012, and negativity, such as throughout 2010 and 2011. Prior to Obama's presidency, the Democratic Party had nearly always been viewed more positively than negatively -- averaging a 15-point net favorable rating between 1992 and 2008, despite holding Congress or the presidency for no more than half of that time. In political polling parlance, both major political parties are currently "upside down" with the American public, meaning they have net negative approval ratings.
It has been almost a decade since Americans simultaneously viewed both parties more favorably than not, in July 2005.
Party With Higher Favorables Not Always Election Winner
The Democrats currently lead their Republican rivals in overall favorable ratings, but even if they are able to maintain this position throughout the 2014 midterm election cycle, it hardly augurs success for the party. There have been several instances in the eight elections from 1996-2012 (the 1998 midterm contest is excluded) in which the more popular party has failed to dominate the November elections.
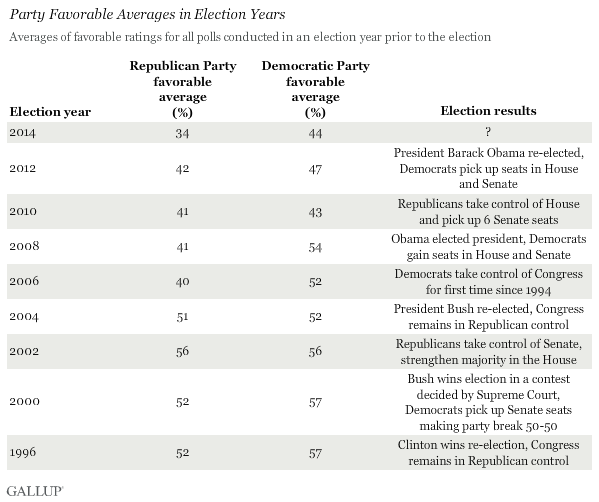
Election results appear to more clearly favor one party in years when a majority of the country sees that party but not the other in a favorable light. This happened in 2006 and 2008, when the Democrats enjoyed majority average favorable ratings, while about four in 10 Americans had a favorable opinion of the Republican Party. Both elections were Democratic sweeps, with the 2008 elections giving Democrats control over both Congress and the White House for the first time since 1994.
The Republican rout in the 2010 midterms was not foreshadowed in the party's 41% average favorable rating that year, which was essentially no better than perceptions of the party in the election years of 2006 and 2008. However, views of the Democratic Party in 2010 had tumbled from the 2008 average by 11 points, indicating growing disenchantment with the ruling party. Even though the Democrats' 2010 average favorable rating was an insignificant two points higher than the Republicans', Republicans won the House handily and gained Senate seats.
Implications
The Democratic Party maintains a slender lead in favorability over the Republican Party, but both parties are "upside down" in net favorability. The fact that the public does not see either party positively suggests both parties will likely face some difficulties in convincing voters to give them their support this November. But for now, the Republican Party may have the most reason for concern: if its favorability rating hovers in the range in which it currently resides, this will be the lowest favorability rating either party has ever held in an election year. Given the GOP's big hopes this fall -- including claiming a Senate majority -- this low rating could cast cold water on these lofty objectives.
Survey Methods
Results for this Gallup poll are based on telephone interviews conducted April 24-30, 2014, on the Gallup Daily tracking survey, with a random sample of 1,513 adults, aged 18 and older, living in all 50 U.S. states and the District of Columbia.
For results based on the total sample of national adults, the margin of sampling error is ±3 percentage points at the 95% confidence level.
Interviews are conducted with respondents on landline telephones and cellular phones, with interviews conducted in Spanish for respondents who are primarily Spanish-speaking. Each sample of national adults includes a minimum quota of 50% cellphone respondents and 50% landline respondents, with additional minimum quotas by time zone within region. Landline and cellular telephone numbers are selected using random-digit-dial methods. Landline respondents are chosen at random within each household on the basis of which member had the most recent birthday.
Samples are weighted to correct for unequal selection probability, nonresponse, and double coverage of landline and cell users in the two sampling frames. They are also weighted to match the national demographics of gender, age, race, Hispanic ethnicity, education, region, population density, and phone status (cellphone only/landline only/both, and cellphone mostly). Demographic weighting targets are based on the most recent Current Population Survey figures for the aged 18 and older U.S. population. Phone status targets are based on the most recent National Health Interview Survey. Population density targets are based on the most recent U.S. census. All reported margins of sampling error include the computed design effects for weighting.
In addition to sampling error, question wording and practical difficulties in conducting surveys can introduce error or bias into the findings of public opinion polls.
View survey methodology, complete question responses, and trends.
For more details on Gallup's polling methodology, visit www.gallup.com.