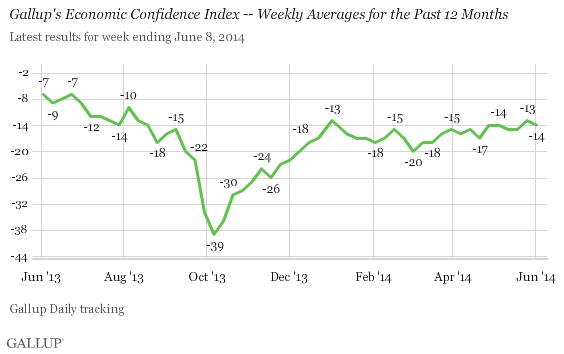
WASHINGTON, D.C. -- Gallup's Economic Confidence Index registered -14 for the week ending June 8. This reading is virtually the same as the -13 average recorded the previous week, which tied as the most positive in 2014 to date.
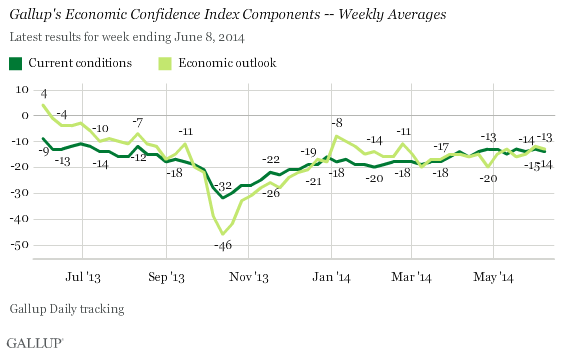
Gallup's Economic Confidence Index is the average of two components: Americans' views on the current economic situation and their perceptions of whether the economy is getting better or worse. The theoretical high is 100, if all Americans were to say the economy is "excellent" or "good" and that it is getting better; the theoretical low is -100, if all Americans were to say the economy is "poor" and getting worse.
Gallup has tracked Americans' confidence in the economy daily since 2008. During this time, the weekly index score has ranged from a high of -3 in May and early June 2013 to a low of -65 in October 2008 during the economic recession. Compared with previous years, Americans' views of the economy have been more stable in 2014, showing significantly smaller fluctuations than usual.
Currently, roughly one in five Americans (21%) view the economy as excellent or good, while more than one in three (35%) say economic conditions are poor. The difference results in a current conditions rating of -14. Forty-four percent view current conditions as "only fair."
In terms of their outlook for the economy's future, 41% of Americans feel the economy is getting better, while more than half (54%) perceive the economy to be getting worse. This results in an economic outlook rating of -13.
Bottom Line
Economic confidence hasn't changed much in 2014 so far, with weekly index readings staying within an eight-point range, between -13 and -20, since January.
There have been signs of incremental improvement, though, with confidence averaging -14 in May, and continuing at that level in early June, compared with -16 or -17 monthly readings between January and April. However slight the progress may be, confidence has reached some modest benchmarks recently, such as a five-month high for weekly confidence.
June could be poised to retain these increases, and possibly surpass them. But given the wide daily fluctuations within the first week of this month -- daily averages dipped as low as -18, but landed at -10 by the week's end -- the outlook for the rest of the month is difficult to predict.
Survey Methods
Results for this Gallup poll are based on telephone interviews conducted June 2-8, 2014, on the Gallup Daily tracking survey, with a random sample of 3,046 adults, aged 18 and older, living in all 50 U.S. states and the District of Columbia.
For results based on the total sample of national adults, the margin of sampling error is ±2 percentage points at the 95% confidence level.
Interviews are conducted with respondents on landline telephones and cellular phones, with interviews conducted in Spanish for respondents who are primarily Spanish-speaking. Each sample of national adults includes a minimum quota of 50% cellphone respondents and 50% landline respondents, with additional minimum quotas by time zone within region. Landline and cellular telephone numbers are selected using random-digit-dial methods. Landline respondents are chosen at random within each household on the basis of which member had the most recent birthday.
Samples are weighted to correct for unequal selection probability, nonresponse, and double coverage of landline and cell users in the two sampling frames. They are also weighted to match the national demographics of gender, age, race, Hispanic ethnicity, education, region, population density, and phone status (cellphone only/landline only/both, and cellphone mostly). Demographic weighting targets are based on the most recent Current Population Survey figures for the aged 18 and older U.S. population. Phone status targets are based on the most recent National Health Interview Survey. Population density targets are based on the most recent U.S. census. All reported margins of sampling error include the computed design effects for weighting.
In addition to sampling error, question wording and practical difficulties in conducting surveys can introduce error or bias into the findings of public opinion polls.
For more details on Gallup's polling methodology, visit www.gallup.com.