This article is part of an ongoing series exploring in-depth trends in Americans' consumer spending habits.
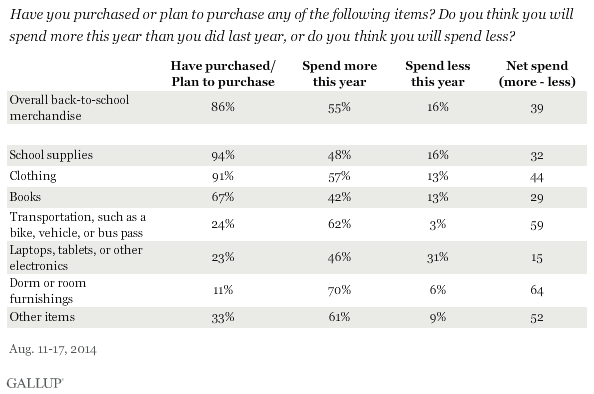
WASHINGTON, D.C. -- As students return to class this school year, 86% of American consumers with children in K-12 or college (or both) plan to purchase some back-to-school merchandise, such as school supplies, books, clothing, and electronics.

These results are from a Gallup survey conducted Aug. 11-17, 2014.
Among those planning to purchase back-to-school items, more than half (55%) say they will spend more this year than last year, while 16% say they will spend less.
Topping the list of this year's most common back-to-school purchases are school supplies (94%) and clothing (91%). Books are a distant third, with 67% of parents having purchased or intending to purchase them. Less than a quarter of parents plan to purchase transportation-related items (24%) or computers or other electronic equipment (23%). Just one in nine plan to purchase dorm or room furnishings (11%), reflective of the relatively small percentage of parents who have college students living away from home. More than four in 10 back-to-school purchasers spent or expect to spend more this year than last year across all categories, with roughly half having spent or expecting to spend more on clothing, transportation, and dorm or room furnishings.
Implications
Most Americans with school-age or college-bound children will purchase or have already purchased back-to-school merchandise. Since this is the first time that Gallup has measured back-to-school spending in this way, we do not know whether these findings are a departure from previous years. Fewer parents plan on larger-ticket purchases (computers, electronics, transportation, and dorm furnishings) than on smaller ones (clothing, books, and school supplies). Perhaps most importantly, a significant percentage of Americans expect to pay more for these purchases this year compared with last.
Survey Methods
Results for this Gallup poll are based on telephone interviews conducted Aug. 11-17, 2014, with a random sample of 1,014 adults, aged 18 and older, living in all 50 U.S. states and the District of Columbia.
For results based on the total sample of national adults, the margin of sampling error is ±4 percentage points at the 95% confidence level.
Interviews are conducted with respondents on landline telephones and cellular phones. Interviews were conducted in English and Spanish. Each sample of national adults includes a minimum quota of 50% cellphone respondents and 50% landline respondents, with additional minimum quotas by time zone within region. Landline and cellular telephone numbers are selected using random-digit-dial methods. Landline respondents are chosen at random within each household on the basis of which member had the most recent birthday.
Samples are weighted to correct for unequal selection probability, nonresponse, and double coverage of landline and cell users in the two sampling frames. They are also weighted to match the national demographics of gender, age, race, Hispanic ethnicity, education, region, population density, and phone status (cellphone only/landline only/both, and cellphone mostly). Demographic weighting targets are based on the most recent Current Population Survey figures for the aged 18 and older U.S. population. Phone status targets are based on the most recent National Health Interview Survey. Population density targets are based on the most recent U.S. census. All reported margins of sampling error include the computed design effects for weighting.
In addition to sampling error, question wording and practical difficulties in conducting surveys can introduce error or bias into the findings of public opinion polls.
For more details on Gallup's polling methodology, visit www.gallup.com.

