PRINCETON, NJ -- With less than two months to go before the midterm congressional elections, 14% of Americans approve of how Congress is handling its job. This rating is one of the lowest Gallup has measured in the fall before a midterm election since 1974.
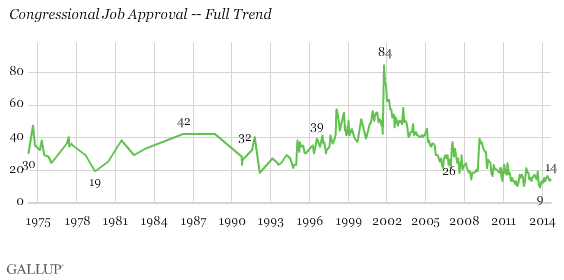
Americans' rating of Congress, from Gallup's latest Social Series survey, conducted Sept. 4-7, is barely changed from the August reading, and matches the 14% average so far in 2014. The all-time low congressional approval rating is 9%, measured in November 2013.
In September 2010, just before that year's midterm elections in which the Republicans took control of the House with a sweeping 63-seat change, congressional approval was 18%, slightly higher than it is today. Four years before that, Congress approval was 29% in September 2006 -- an election in which the Democrats did well and took control of both houses.
Previous Gallup analysis shows that low Congress approval is associated with higher seat turnover. That review also suggested that when the president's party and the majority party in Congress are different, as they are now, voters' frustration with Congress is more likely to be taken out on the party of the president, although this conclusion is based on a limited number of recent elections.
Most observers believe the Republicans are in little jeopardy of losing control of the House this year, so more of the focus has been on the states with Senate races. Given the idiosyncratic nature of the particular senators and states that have Senate seats up for election this year, the impact of the negative attitudes about Congress in general on specific Senate races is difficult to predict.
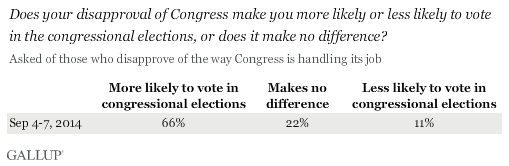
Still, when asked directly, two-thirds of those who disapprove of Congress say this makes them more likely to vote in the congressional elections; only 11% say it makes them less likely to vote in the elections. Taken at face value, these responses suggest that the historic disapproval ratings in a midterm year may bring more voters to the polls. There is little difference in these responses by partisan identification.
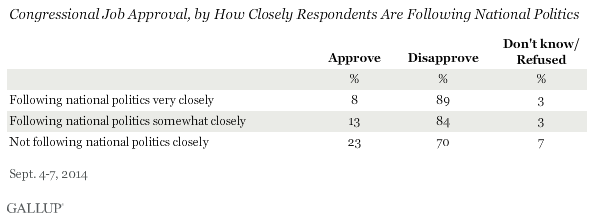
Approval Is Lower Among Those Paying the Most Attention to National Politics
Members of Congress can take little comfort in the finding that those who are paying closest attention to national politics are the most negative about the institution's performance. Only 8% of the one-third of all Americans who are following national politics "very closely" approve of the way Congress is handling its job. On the other hand, Americans who say they are not following national politics closely are the most positive, with 23% saying they approve.
Implications
The current 14% congressional job approval rating is one of the lowest Gallup has recorded in the fall of a midterm election year since Gallup first measured approval of Congress in the current format in 1974. Americans indicate that these negative attitudes will increase their probability of voting this fall, and history suggests it is more likely that Democrats than Republicans will suffer as a result, given Democratic control of the White House.
Survey Methods
Results for this Gallup poll are based on telephone interviews conducted Sept. 4-7, 2014, on the Gallup Daily tracking survey, with a random sample of 1,017 adults, aged 18 and older, living in all 50 U.S. states and the District of Columbia.
For results based on the total sample of national adults, the margin of sampling error is ±4 percentage points at the 95% confidence level.
Interviews are conducted with respondents on landline telephones and cellular phones, with interviews conducted in Spanish for respondents who are primarily Spanish-speaking. Each sample of national adults includes a minimum quota of 50% cellphone respondents and 50% landline respondents, with additional minimum quotas by time zone within region. Landline and cellular telephone numbers are selected using random-digit-dial methods. Landline respondents are chosen at random within each household on the basis of which member had the most recent birthday.
Samples are weighted to correct for unequal selection probability, nonresponse, and double coverage of landline and cell users in the two sampling frames. They are also weighted to match the national demographics of gender, age, race, Hispanic ethnicity, education, region, population density, and phone status (cellphone only/landline only/both, and cellphone mostly). Demographic weighting targets are based on the most recent Current Population Survey figures for the aged 18 and older U.S. population. Phone status targets are based on the most recent National Health Interview Survey. Population density targets are based on the most recent U.S. census. All reported margins of sampling error include the computed design effects for weighting.
In addition to sampling error, question wording and practical difficulties in conducting surveys can introduce error or bias into the findings of public opinion polls.
View survey methodology, complete question responses, and trends.
For more details on Gallup's polling methodology, visit www.gallup.com.