This article is part of an ongoing series exploring in-depth trends in Americans' consumer spending habits.
WASHINGTON, D.C. -- With fall about to begin, 44% of Americans say they have spent more over the past four weeks than they did at the same time a year ago. This is unchanged from earlier in the summer (45%). However, 23% now say they are spending less than a year ago, a noteworthy increase from 18% in the previous poll.
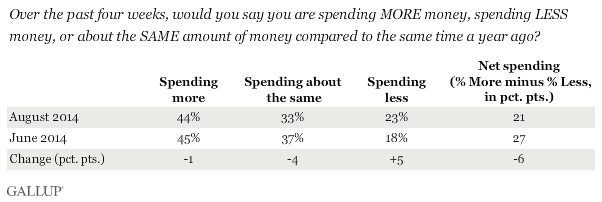
These results represent comparative self-reports of spending compared with what Americans remember about a year ago, and thus reflect attitudes about how much people are spending rather than actual dollar amounts. In fact, Gallup's ongoing measure of the amount Americans report spending each day for June and for August show values that are similar to the dollar amounts they report for the same months in 2013. Thus, it appears Americans perceive a larger outflow of money, regardless of whether it actually is higher.
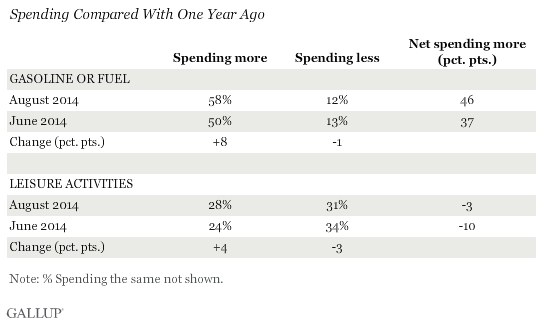
Last week, Gallup reported Americans' late-summer back-to-school spending. A similar percentage of Americans today compared with earlier this summer say they are spending the same amount on a variety of types of purchases, with the exception of gasoline or fuel, and leisure activities. The percentage of Americans saying they are spending more on gasoline rose eight percentage points to 58%. Given that this poll was conducted near the end of the summer driving season, this finding is not unexpected.
The bright spot in terms of the nation's retail economy was a slight increase in the percentage of Americans now saying they are spending more on leisure activities than said so a few months ago (28% vs. 24%, respectively). It remains to be seen whether this is related to typical summer spending patterns or the start of a more general trend.
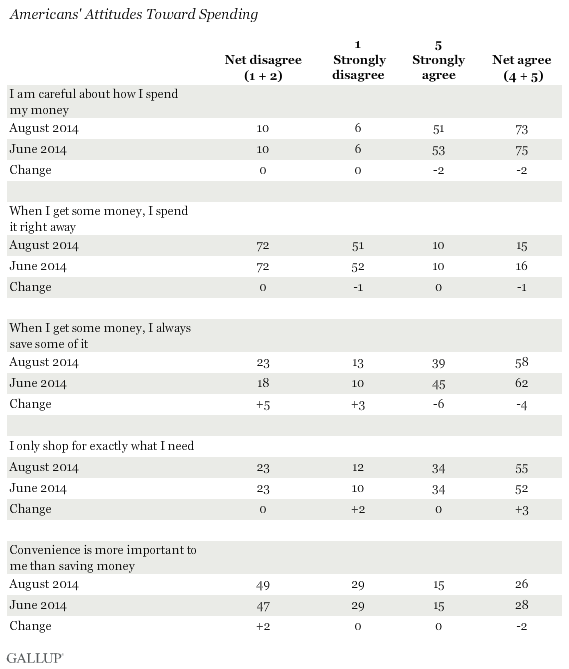
Attitudes toward spending and saving are also remarkably similar to those in mid-June 2014. The only notable change is a significant six-point decline in the percentage of Americans who strongly agree that "When I get some money, I always save some of it." These attitudes in general show that Americans like to perceive themselves as being careful with their money and saving, as Gallup has shown using other similar indicators.
Implications
As the summer wanes, consumer spending patterns have been quite stable, with few changes from last wave, which could mainly result from seasonal patterns in spending. A multitude of Americans continue to perceive that they are spending more than a year ago, but not on discretionary purchases. The only notable change in the most recent results is an increase in the percentage of consumers who say they are spending less. It remains to be seen whether this is the start of a trend. Although these self-reports on comparative spending do not necessarily represent actual changes in highly stable spending patterns, they do provide a window into how consumers perceive their spending.
Survey Methods
Results for this Gallup poll are based on telephone interviews conducted Aug. 11-17, 2014, with a random sample of 1,014 adults, aged 18 and older, living in all 50 U.S. states and the District of Columbia.
For results based on the total sample of national adults, the margin of sampling error is ±4 percentage points at the 95% confidence level.
Interviews are conducted with respondents on landline telephones and cellular phones, with interviews conducted in Spanish for respondents who are primarily Spanish-speaking. Each sample of national adults includes a minimum quota of 50% cellphone respondents and 50% landline respondents, with additional minimum quotas by time zone within region. Landline and cellular telephone numbers are selected using random-digit-dial methods. Landline respondents are chosen at random within each household on the basis of which member had the most recent birthday.
Samples are weighted to correct for unequal selection probability, nonresponse, and double coverage of landline and cell users in the two sampling frames. They are also weighted to match the national demographics of gender, age, race, Hispanic ethnicity, education, region, population density, and phone status (cellphone only/landline only/both, and cellphone mostly). Demographic weighting targets are based on the most recent Current Population Survey figures for the aged 18 and older U.S. population. Phone status targets are based on the most recent National Health Interview Survey. Population density targets are based on the most recent U.S. census. All reported margins of sampling error include the computed design effects for weighting.
In addition to sampling error, question wording and practical difficulties in conducting surveys can introduce error or bias into the findings of public opinion polls.
For more details on Gallup's polling methodology, visit www.gallup.com.