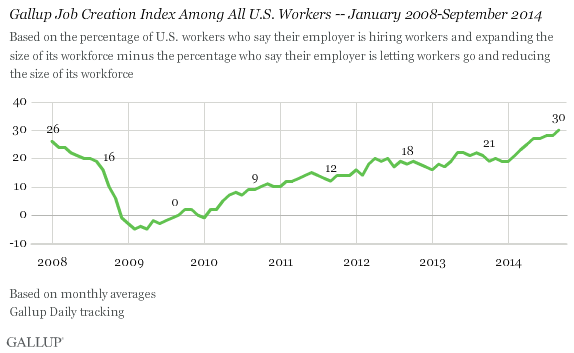
WASHINGTON, D.C. -- Gallup's U.S. Job Creation Index reached a six-year high of +30 in September. This is up from twin readings of +28 in July and August.

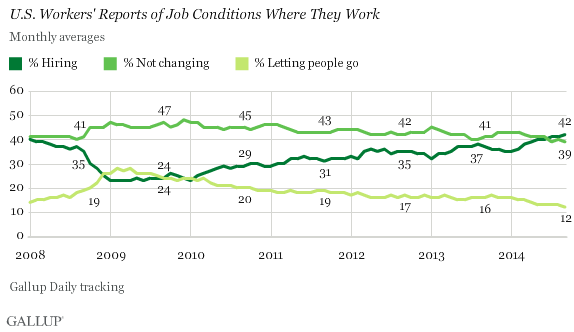
Gallup's Job Creation Index is a measure of net hiring activity in the U.S., with the monthly average based on a nationally representative sample of more than 16,000 full- and part-time workers in September. September's +30 index score is based on 42% of employees saying their employer is hiring workers and expanding the size of its workforce -- the highest figure Gallup has recorded since 2008 -- and 12% saying their employer is letting workers go and reducing the size of its workforce. Another 39% reported no change in staffing.
For the third month in a row -- and only the third time since 2008 -- workers were slightly more likely to report that their employer is hiring than they were to report no changes in their workforce.

While Nongovernment Hiring Is Up, Government Hiring Is Down
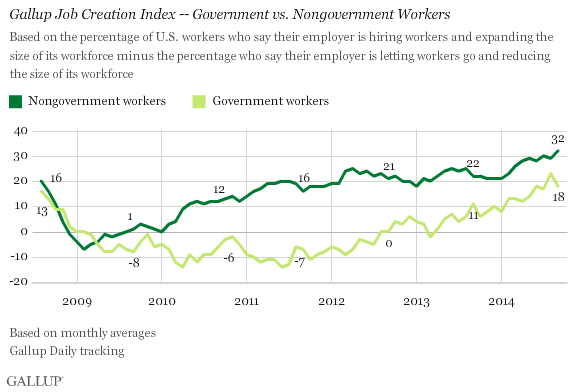
The uptick in job creation is because of a new high for nongovernment hiring, which reached an index reading of +32. Forty-three percent of nongovernment workers said their employer is hiring, while 11% said their employer is letting people go.
Meanwhile, hiring amongst government employees is down five index points, at a current reading of +18.

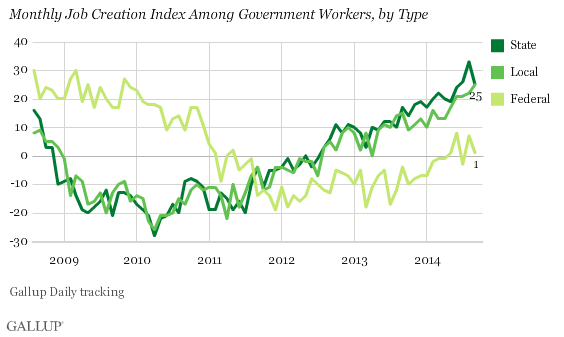
According to these worker reports, local government was the only level of government that had an increase in net hiring in September, while both federal and state government workers reported drops in hiring.
At both the state and local government levels, 38% of workers reported that their employers are hiring, while 13% said they are letting people go -- resulting in index readings of +25 for each. Federal government workers, meanwhile, reported the lowest levels of hiring, with 32% saying their employers are hiring and 31% reporting that their employers are trimming their staff. This resulted in an index score of +1 for federal hiring.

Bottom Line
Among Gallup's economic indicators, job creation has offered some of the most promising signals in 2014. And though it has generally been on the rise since 2010, it has had a steeper incline this year than in any of the previous years since Gallup started tracking the index in 2008.
U.S. workers are clearly sensing a greater level of hiring, but so far this hasn't altered the American public's view of the health of the nation's economy, with the Gallup Economic Confidence Index staying remarkably flat near -16 in 2014. But if hiring gains persist through the end of the year, these improvements might finally budge Americans' dismal confidence in the economy.
Survey Methods
Results for this Gallup poll are based on telephone interviews conducted Sept. 1-30, 2014, on the Gallup Daily tracking survey, with a random sample of 16,558 adults, aged 18 and older, employed full or part time, living in all 50 U.S. states and the District of Columbia.
For results based on the total sample of workers, the margin of sampling error is ±1 percentage point at the 95% confidence level.
Interviews are conducted with respondents on landline telephones and cellular phones, with interviews conducted in Spanish for respondents who are primarily Spanish-speaking. Each sample of national adults includes a minimum quota of 50% cellphone respondents and 50% landline respondents, with additional minimum quotas by time zone within region. Landline and cellular telephone numbers are selected using random-digit-dial methods. Landline respondents are chosen at random within each household on the basis of which member had the most recent birthday.
Samples are weighted to correct for unequal selection probability, nonresponse, and double coverage of landline and cell users in the two sampling frames. They are also weighted to match the national demographics of gender, age, race, Hispanic ethnicity, education, region, population density, and phone status (cellphone only/landline only/both, and cellphone mostly). Demographic weighting targets are based on the most recent Current Population Survey figures for the aged 18 and older U.S. population. Phone status targets are based on the most recent National Health Interview Survey. Population density targets are based on the most recent U.S. census. All reported margins of sampling error include the computed design effects for weighting.
In addition to sampling error, question wording and practical difficulties in conducting surveys can introduce error or bias into the findings of public opinion polls.
For more details on Gallup's polling methodology, visit www.gallup.com.
