Story Highlights
- Current index ties most positive reading so far in 2014
- Current conditions score one of best Gallup has found
- Economic outlook ties best reading since late February
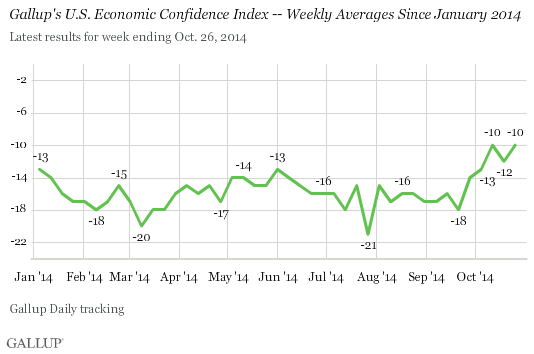
WASHINGTON, D.C. -- In the U.S., Gallup's Economic Confidence Index was -10 for the week ending Oct. 26, in line with where it has been the past three weeks and tied for the most positive reading so far in 2014.

Prior to October, the index had stayed within a narrow range in 2014, remaining between -13 and -21. However, confidence has increased in October, and the index has stayed between -10 and -13 across the four weeks of the month. Before this month, scores of -10 had not been seen since August 2013.
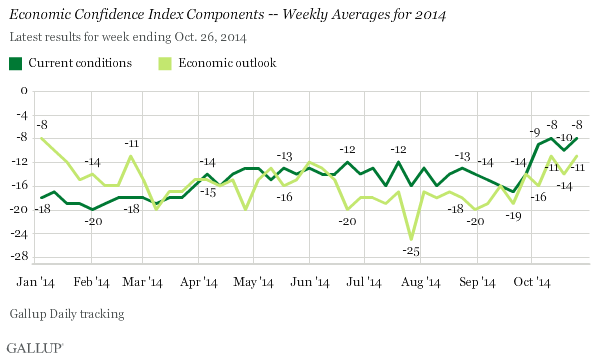
Gallup's Economic Confidence Index is the average of two components: Americans' views on current economic conditions and whether they think the economy will get better or get worse. Both components increased last week to match scores seen two weeks prior.
Last week, 23% of Americans said the economy was "excellent" or "good," while 31% said it was "poor." This resulted in a current conditions score of -8, roughly the same as it has been in October and on par with some of the highest scores Gallup has seen since daily tracking began in 2008. Last week, 42% of Americans said the economy was "getting better" while 53% said it was "getting worse," resulting in an economic outlook score of -11, tied for the best since late February.

Implications
Americans are more confident in the economy now than they were earlier in 2014. This recent movement may be tied to the dip in gas prices, with average prices down to their lowest level in four years. And while stock prices dropped drastically two weeks ago, they rebounded and the market closed on Friday with its best week in two years. While fears of Ebola and nervousness over the European economy may be giving investors pause, Americans remain more confident in the U.S. economy than they have been since August 2013.
Survey Methods
Results for this poll are based on telephone interviews conducted Oct. 20-26, 2014, on the Gallup Daily tracking survey, with a random sample of 3,535 adults, aged 18 and older, living in all 50 U.S. states and the District of Columbia. For results based on the total sample of national adults, the margin of sampling error is ±2 percentage points at the 95% confidence level.
Each sample of national adults includes a minimum quota of 50% cellphone respondents and 50% landline respondents, with additional minimum quotas by time zone within region. Landline and cellular telephone numbers are selected using random-digit-dial methods.
Learn more about the Gallup Daily tracking methodology.

