Story Highlights
- Daily spending reports up to $95 average in November
- Last month's increase continues the trend seen since October
- October-to-November increase of $6 largest in six years
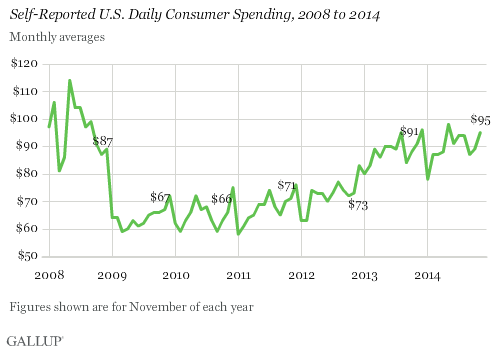
WASHINGTON, D.C. -- In the U.S., daily self-reports of spending averaged $95 in November, up from $89 in October. This is also up slightly from the $91 found in November 2013, and remains well above the lower averages found in 2009 through 2012.

The November 2014 average consumer spending figure is based on Gallup Daily tracking interviews throughout November with more than 14,000 U.S. adults. The poll asks Americans about the total amount they spent "yesterday" in stores, restaurants, gas stations or online -- not counting home and vehicle purchases, or normal monthly bills -- and provides an indication of Americans' discretionary spending.
In past years, spending has been stable from October to November. Spending has increased by $3 or more between these two months only twice before, in 2010 and 2013, since Gallup began daily tracking in 2008. However, spending typically increases in December, with an average increase over the past six Decembers of $6, and ranging between increases of $2 in 2008 and $10 in 2012.
Spending Increased Among Americans of All Incomes
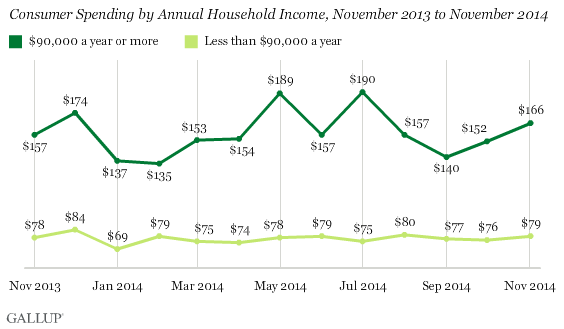
Spending among middle- and lower-income Americans, those with annual household incomes of less than $90,000 a year, increased to $79 in November from $76 in October. Middle- and lower-income Americans make up the bulk of U.S. consumers; however, they typically spend less than upper-income Americans do, and their spending varies less from month to month. November's average of $79 is similar to the $80 average in August, but it has averaged slightly less in the months since then.

Spending among upper-income Americans, those with annual household incomes of $90,000 or more, continued to increase in November, reaching an average of $166. In October, it showed an increase of $12 to $152.
Three-Day Rolling Average Reached $111 Over Holiday Weekend
Gallup's three-day rolling averages picked up toward the end of the month. Spending topped $100 for Nov. 19-21, a week prior to the Thanksgiving holiday, and averaged $111 over Black Friday and the holiday weekend. Previously in the month, three-day rolling averages had been in the $80s and $90s, and hadn't climbed higher than $100 since the end of October.
Bottom Line
The increase in Americans' reported spending in November could be a positive sign for the holiday shopping season, if spending reports show the usual increase from November to December. Separate Gallup research predicts a stronger holiday season than in 2013, albeit only slightly stronger -- a majority of Americans (54%) say they plan to spend the same as last year. So far in 2014, spending typically has increased when compared with the corresponding month in 2013. And the 2014 spending averages remain much higher than Gallup measured in 2009 to 2012.
Survey Methods
Results for this Gallup poll are based on telephone interviews conducted Nov. 1-30, 2014, on the Gallup U.S. Daily survey, with a random sample of 14,697 adults, aged 18 and older, living in all 50 U.S. states and the District of Columbia. For results based on the total sample of national adults, the margin of sampling error is ±1 percentage point at the 95% confidence level. The margin of error for the spending mean is ±$4.
Each sample of national adults includes a minimum quota of 50% cellphone respondents and 50% landline respondents, with additional minimum quotas by time zone within region. Landline and cellular telephone numbers are selected using random-digit-dial methods.
Learn more about how Gallup Daily tracking works.

