Story Highlights
- Index ticks up one point to +28 in November
- Federal government hiring reaches four-year high
WASHINGTON, D.C. -- Gallup's U.S. Job Creation Index ticked up one point in November to +28 after a three-point slip in October. The index sits just below the all-time high of +30 reached in September and is the highest reading in any November since Gallup began tracking the index in 2008.
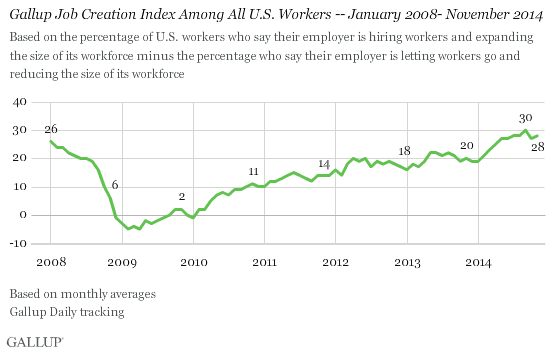
The slight improvement in November comes on the heels of the first month-to-month dip seen this year in Americans' self-reports of hiring at their workplace. The index had seen gradual improvements throughout the year, but the drop in October delivered a correction to that trend.
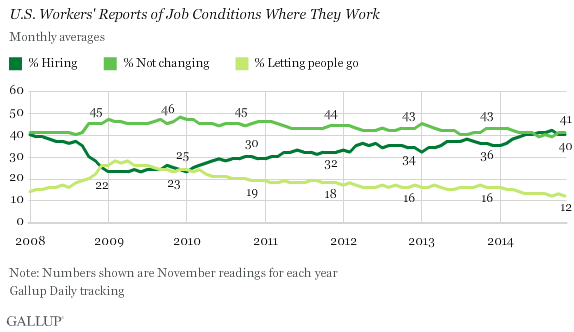
Gallup's Job Creation Index is a measure of net hiring activity in the U.S., with the November average based on a nationally representative sample of nearly 17,000 full- and part-time workers. November's +28 index score is based on 40% of employees saying their employer is hiring workers and expanding the size of its workforce and 12% saying their employer is letting workers go and reducing the size of its workforce. Forty-one percent reported no changes in staffing at their place of work.
Reports of Government and Nongovernment Hiring Both Tick Up
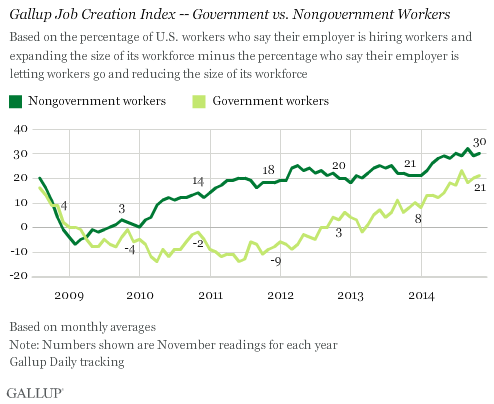
Net hiring reports among both government (+21) and nongovernment (+30) workers each ticked up a point last month and remain near their respective high points in Gallup's seven-year trend. In November, 37% of government workers reported hiring at their workplaces and 16% reported job reductions. Among nongovernment workers, 41% reported staffing increases and 11% staffing reductions. As has been the case in every month since early 2009, nongovernmental workers report more net hiring activity than government workers.
Government hiring peaked at +23 in August before slipping slightly in September. After being in negative territory for nearly all of 2009 through 2012, net government hiring moved into positive territory in 2013 and continued to rise in 2014. The current reading is the highest figure Gallup has recorded in any November since 2008.
The +30 for nongovernmental workers is just shy of the record high +32 from September. Nongovernment net hiring gradually increased in January through May, but it has since generally stabilized.
Reports of State and Local Government Hiring More Positive Than Federal
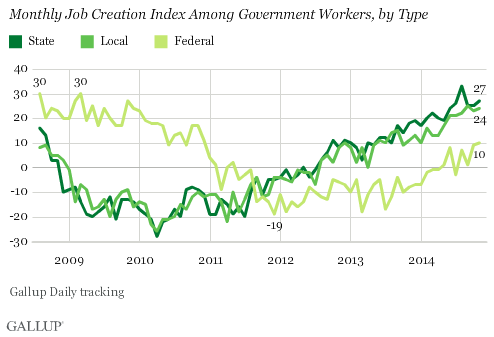
State and local government workers, who make up the large majority of the government workforce, continue to report a fairly positive hiring situation, with indexes of +27 and +24, respectively. Both index scores ticked up slightly in November.
Federal workers' hiring reports also improved in November, by one point to +10, but remain well below those of state and local government workers. Federal workers' hiring reports peaked at +30 on two occasions, in August 2008 and March 2009, but fell over the years, reaching a low of -19 in December 2011. Federal workers' reports of hiring in their place of employment had been consistently in negative territory since 2011, but emerged positive in May of this year.
Bottom Line
Though Gallup's U.S. Job Creation Index reached new highs in recent months, the improvement has slowed compared with the first half of 2014, when four straight increases breathed new life into an index that did not see nearly as much movement in 2013. Since May, the index has remained in a narrow four-point range.
Still, employees' hiring reports are much more positive than they have been at most points over the past seven years, providing some good news alongside Americans' 17-month high in economic confidence and higher November spending reports than in previous years.
In the seven years Gallup has tracked the Job Creation Index trend, it has never increased from November to December, suggesting that an uptick this month would be unlikely. But if the index merely stays where it is, it would end the year on a better note than it has in several years.
Survey Methods
Results for this Gallup poll are based on telephone interviews conducted Nov. 1-30, 2014, on the Gallup Daily tracking survey, with a random sample of 16,787 adults, aged 18 and older, employed full or part time and living in all 50 U.S. states and the District of Columbia. For results based on the total sample of working adults, the margin of sampling error is ±1 percentage points at the 95% confidence level.
Each sample of national adults includes a minimum quota of 50% cellphone respondents and 50% landline respondents, with additional minimum quotas by time zone within region. Landline and cellular telephone numbers are selected using random-digit-dial methods.
Learn more about how Gallup Daily tracking works.

