Story Highlights
- Gallup Economic Confidence Index up seven points to +2
- First positive score since Gallup began tracking in 2008
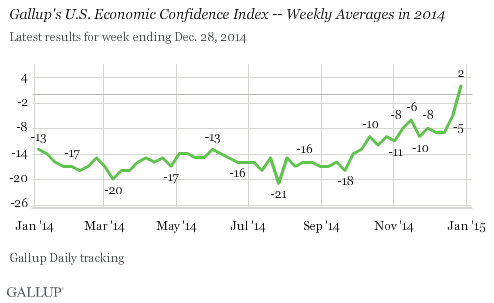
WASHINGTON, D.C. -- Gallup's U.S. Economic Confidence Index last week tipped into positive territory for the first time since before the Great Recession started in December 2007. The index averaged +2 for the week ending Dec. 28, a possible sign that Americans are feeling the accelerating economic recovery.
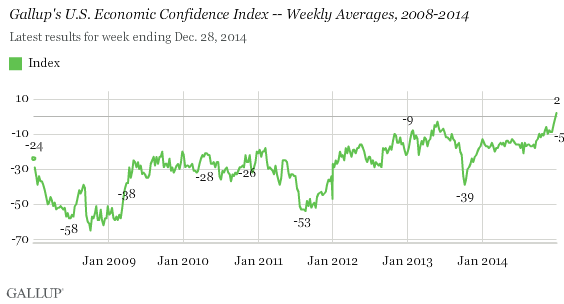
Gallup's three-day rolling averages during the week of Dec. 22-28 ranged from -2 to +4. These dates include the lead-up to the Christmas holiday, an especially busy time for the economy. However, Gallup data from past years do not reveal a consistent pattern of Americans' overall economic confidence increasing during the Christmas season, suggesting this improvement is more attributable to structural, rather than seasonal, factors.
After months of little movement, the Economic Confidence Index started its climb in mid-September. While various factors likely contribute to the rise in economic confidence, the weekly average price of gas in the U.S. began to fall precipitously in the late summer and, over the last four months, the price has fallen by nearly 30% -- an economic boon to most Americans. In fact, for the week of Dec. 22, the average price of gasoline was as low as it has been since the first half of 2009. Additionally, the U.S. stock market rose in December to its highest levels in history while Gallup's unemployment rate fell to the lowest since its daily tracking began in January 2008. Other government economic measures also showed a significant uptick in positive economic news.
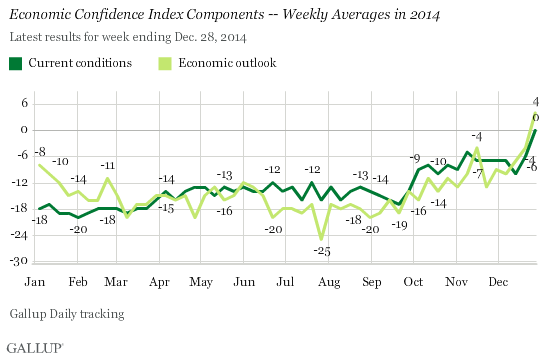
Gallup's Economic Confidence Index is the average of two components: Americans' views of current economic conditions and their perceptions of whether the economy is getting better or worse. The index has a theoretical maximum of +100 if all Americans rated current conditions as excellent or good and saw the economy as getting better -- and a theoretical minimum of -100 if all Americans viewed current conditions as poor and thought the economy was getting worse.
As a result, positive scores indicate Americans, on balance, view the economy positively, and negative scores indicate they view the economy negatively. The weekly average of +2 last week is particularly notable because it is the first time it has escaped negative territory since the recession.
The current conditions component saw a six-point increase last week, while the outlook component increased by eight points.
For the week ending Dec. 28, 27% of Americans said the economy was "excellent" or "good," while 27% said it was "poor," resulting in a current conditions index score of 0. Meanwhile, 49% of Americans said the economy is "getting better" and 45% said it is "getting worse," resulting in an outlook score of +4.
Bottom Line
U.S. consumers' attitudes are ending the year on a high note, as their confidence in the economy is back in the black for the first time since the Great Recession and the stunted recovery. And, judging from past years, economic perceptions are more likely than not to continue to improve. Gallup has found that confidence typically increases in January, with monthly index increases between the last and first months of the year ranging between one and 11 points.
Survey Methods
Results for this Gallup poll are based on telephone interviews conducted Dec. 22-28, 2014, on the Gallup U.S. Daily survey, with a random sample of 2,541 adults, aged 18 and older, living in all 50 U.S. states and the District of Columbia. For results based on the total sample of national adults, the margin of sampling error is ±2 percentage points at the 95% confidence level. All reported margins of sampling error include computed design effects for weighting.
Each sample of national adults includes a minimum quota of 50% cellphone respondents and 50% landline respondents, with additional minimum quotas by time zone within region. Landline and cellular telephone numbers are selected using random-digit-dial methods.
Learn more about how the Gallup U.S. Daily works.