Story Highlights
- Forty percent see China's economy as critical threat to U.S.
- In 2013-2014, 52% saw China's economy as critical threat
- China slides back as perceived top U.S. enemy
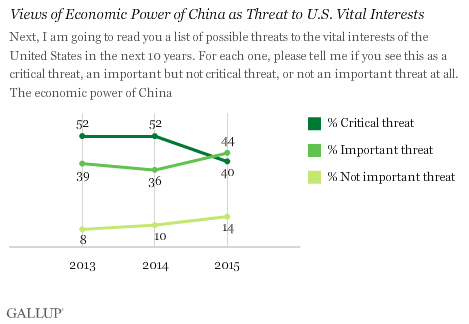
PRINCETON, N.J. -- Forty percent of Americans regard "the economic power of China" as a critical threat to the vital interests of the U.S., down from 52% in both 2013 and 2014. Since last year, Americans have shifted more toward viewing China's economic power as an important but not a critical threat, or as not an important threat.

Gallup's annual World Affairs poll finds China's economic power ranking at the bottom of a list of eight different international threats, with ISIS and international terrorism rated as the gravest threats.
The decline in the percentage of Americans viewing China's economy as a critical threat over the past year may be attributable to the rise of other matters on the world stage, such as the Islamic State or ISIS and the situation in Ukraine. Also, by many measures, the U.S. economy has greatly improved while China's has slowed, making the Chinese economy seem like less of a threat than when the U.S. economy was struggling to emerge from recession and the Chinese economy was growing more quickly. Americans' opinions about which country is the world's leading economic power had shifted from the U.S. to China in recent years amid the weak U.S. economy.
China Fades as Top Enemy
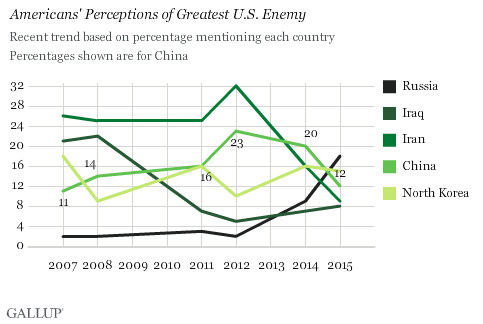
Currently, 12% of Americans name China when asked to say which country they consider the United States' greatest enemy. That is down from 20% in 2014 and 23% in 2012. China currently ranks behind Russia and North Korea, after topping the list in 2014 and finishing second, to Iran, in 2012.

China is distinct from the other countries that typically rank among the top U.S. enemies in that it represents primarily an economic threat to the U.S., whereas Russia, Iran, Iraq and North Korea represent more of a security threat.
Favorable Ratings of China Unchanged
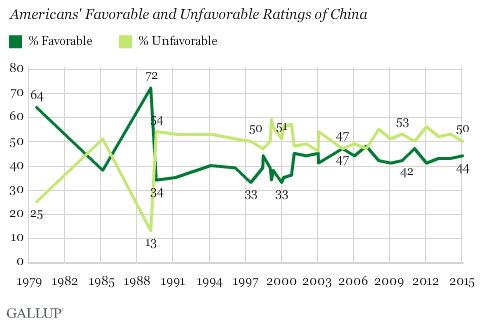
Americans' basic opinions of China, notably, are essentially unchanged from a year ago even as Americans see that country's economic power as less threatening and are less likely to name China as the United States' top enemy. Currently, 50% of Americans have an unfavorable opinion of China and 44% a favorable one, compared with 53% unfavorable and 43% favorable in 2014.
For most of Gallup's nearly 40-year trend, Americans have been more negative than positive toward China.

The major exceptions to the general trend were net positive ratings in 1979, after the U.S. established full diplomatic relations with China, and in early 1989, after President George H.W. Bush's visit.
Americans' views of China became sharply negative after the 1989 Tiananmen Square incident, with a 38-percentage-point drop in its favorable rating, from 72% in February 1989 to 34% in August 1989. These more negative opinions of China persisted over the ensuing decade, with favorable ratings mostly in the 30% range amid ongoing concern about Chinese human rights and tensions over U.S. policy toward Taiwan. Since 2001, Americans have been a bit more positive toward China as it has made attempts to become more open and involved on the world stage, including joining the World Trade Organization.
Implications
Americans view China as a diminished threat, but their basic views of the country are steady, which indicates that the change in perceived threat may have less to do with China itself than with other countries. International events over the past year, particularly the dispute with Russia over the Ukraine situation and the growing influence of ISIS militants in Iraq and Syria, have likely made countries other than China seem more threatening to the U.S.
A U.S. economy that is arguably stronger than at any point since the recession, as well as a slowing Chinese economy, are also possible factors in Americans' seeing China's economic power as less of a threat than in recent years. And as Americans have grown more confident in the health of the U.S. economy, their views of what threatens the U.S. may shift more to security concerns than economic ones.
Survey Methods
Results for this Gallup poll are based on telephone interviews conducted Feb. 8-11, 2015, with a random sample of 837 adults, aged 18 and older, living in all 50 U.S. states and the District of Columbia. For results based on the total sample of national adults, the margin of sampling error is ±4 percentage points at the 95% confidence level. All reported margins of sampling error include computed design effects for weighting.
Each sample of national adults includes a minimum quota of 50% cellphone respondents and 50% landline respondents, with additional minimum quotas by time zone within region. Landline and cellular telephone numbers are selected using random-digit-dial methods.
View survey methodology, complete question responses, and trends.
Learn more about how Gallup Poll Social Series works.

