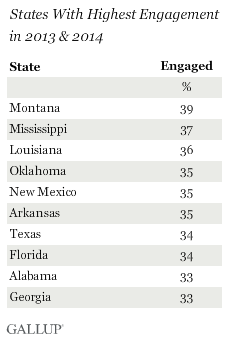
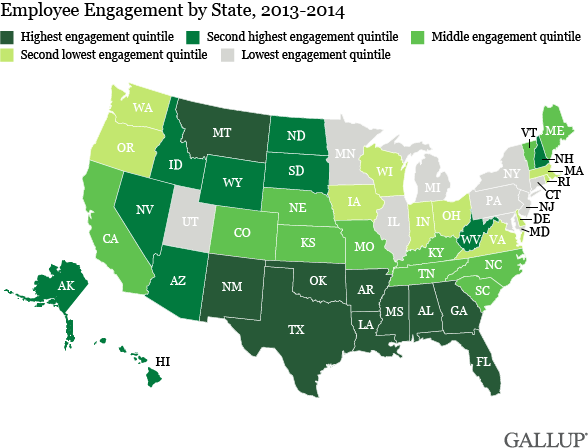
WASHINGTON, D.C. -- Workers in Montana, followed closely by those in Mississippi and Louisiana, had the highest levels of employee engagement in 2013 and 2014. With 22% of workers engaged, the District of Columbia had the lowest employee engagement, followed by New York, Minnesota and Connecticut.

The 2013-2014 employee engagement estimates across states are based on Gallup Daily Tracking interviews conducted Jan. 2013-Dec. 2014, including 166,409 interviews with adults employed full or part time for an employer. Nationally, 31% of workers were engaged during this time period.

Previous Gallup research shows that employee engagement predicts nine performance outcomes for organizations. Business units with engaged workers have 22% higher profitability than those with disengaged workers because they have higher productivity, higher retention rates, fewer accidents on the job and fewer quality defects. As reported in Gallup's 2013 State of the American Workplace report, strong employee engagement is linked to higher customer engagement. And with benefits such as improved overall well-being and physical health, high engagement is also good news for individuals.
Gallup identifies workers as engaged, not engaged or actively disengaged based on their responses to items that assess key workplace elements found to predict important business outcomes.
- Engaged employees are involved in and enthusiastic about their work and workplace. Day after day, they are passionate about their jobs and feel a profound connection to their company. They are more productive, drive innovation and promote organizational growth.
- Not engaged employees are essentially "checked out." They demonstrate less concern about customers, productivity and profitability. They do not own or feel passionately about their work.
- Actively disengaged employees are not just unhappy at work; these employees undermine the accomplishments of their engaged coworkers. They monopolize managers' time, account for more quality defects and quit at a higher rate than engaged employees.
While, for the most part, states with higher percentages of engaged workers have lower percentages of actively disengaged workers, this is not always the case. The District of Columbia, for example, has a relatively low percentage of engaged workers and also a low percentage of actively disengaged workers. Active disengagement tends to be more highly related to labor market trends such as unemployment, underemployment and letting people go.
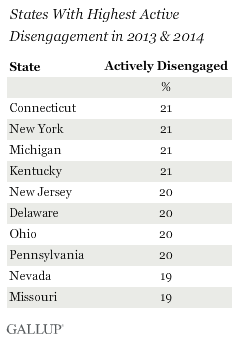
Connecticut, New York, Michigan and Kentucky Highest in Active Disengagement
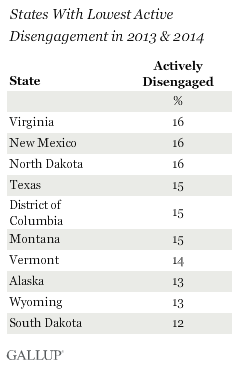
There is a four-way tie between Connecticut, New York, Michigan and Kentucky for the highest percentage of actively disengaged workers -- 21% in each state. Residents of South Dakota, Wyoming, Alaska and Vermont reported the lowest percentages of actively disengaged workers, each with less than 15%. The national average for 2013-2014 was 18% active disengagement.
|
|
|
States with higher active disengagement have significantly higher unemployment and underemployment rates than states with lower active disengagement. For example, the eight states with 20% or more actively disengaged workers averaged 8% unemployment and 18% underemployment. In contrast, the seven states with 15% or less actively disengaged workers averaged only 5% unemployment and 14% underemployment. Employees in states with higher active disengagement are also more likely to report that their company is letting people go (16% compared with 13% for those in states with 15% or fewer actively disengaged workers).
Implications
There are many factors that correlate with engagement and active disengagement that may help with understanding the engagement differences between states. Previous Gallup research shows that employees in very small companies (fewer than 10 employees) have higher rates of engagement and lower rates of active disengagement -- likely related to the psychological ownership and autonomy that is often present in small companies. Gallup finds a similar correlation when comparing state engagement data and U.S. Census Bureau statistics of U.S. businesses: The seven states with the lowest levels of active disengagement are more likely to have a high percentage of firms with fewer than 10 employees than the states with the highest levels of active disengagement. As such, the size of businesses within states may explain some of the state-level engagement differences.
Rates of unemployment and underemployment are also associated with variation in state engagement: There is a general positive correlation between these economic indices and active disengagement. And recent employment statistics and overall U.S. workforce trends suggest that active disengagement has declined in line with decreases in unemployment and underemployment. There are many reasons that may explain the relationship between these economic indices and engagement. A more competitive labor market may boost employers' concern for employees. And Gallup research indicates that newer employees are more engaged than tenured employees -- potentially giving states with more new hires a slight engagement advantage.
Knowing why some states have higher employee engagement than others ultimately requires an examination of the management practices of organizations within each state. While there are significant differences in employee engagement across states, Gallup finds even greater differences in engagement across organizations and among manager-led teams within organizations. For example, some organizations have 70% or more of their employees engaged, while others have less than 20% engaged. Within the same organizations, some managers engage nearly every worker they manage -- while other managers alienate, or disengage, the employees they manage. Organizations that do the best job of hiring talented managers and do the right things systemically to engage their workforce have a much greater chance to grow. Decisions that affect these practices are made by progressive-thinking organizational leaders and entrepreneurs within each state.
Sangeeta Agrawal provided research assistance for this story.
Survey Methods
Results for this Gallup poll are based on telephone interviews conducted January 2013-December 2014 on Gallup Daily tracking, with a random sample of 166,409 adults, aged 18 and older, living in all 50 U.S. states and the District of Columbia.
For results based on the total sample of national adults, the margin of sampling error is ±1 percentage points at the 95% confidence level.
Sample sizes for states ranged from 488 in Delaware to 15,532 in California in 2013-2014. Margins of sampling error for individual states range from ±1 percentage point to ±6 percentage points at the 95% confidence level. All reported margins of sampling error include computed design effects for weighting.
Each sample of national adults includes a minimum quota of 50% cellphone respondents and 50% landline respondents, with additional minimum quotas by time zone within region. Landline and cellular telephone numbers are selected using random-digit-dial methods.
Learn more about how Gallup Daily tracking works.


