Story Highlights
- Four in 10 Americans say they are spending less money
- About a third of U.S. adults reliably say their spending is the same
- Americans spending less are more likely to call it a "new normal"
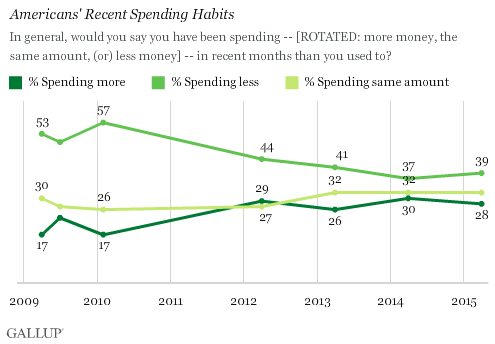
WASHINGTON, D.C. -- As economists and business leaders debate whether the U.S. economy is on the verge of "liftoff," or is stagnating, Americans' changes in their spending patterns are similar to levels they reported in 2012, 2013 and 2014. Importantly, though, the percentage who say they are spending less, 39%, remains well below where it was during the economic downturn.

Americans remain most likely to say they are "spending less money," (39%) rather than "spending the same amount" (32%) or "spending more money" (28%). But their perceptions that they are spending less have dropped from as high as 57% when the economy was just emerging from a deep recession in 2010. As the economy continued to recover, the share dropped to a low of 37% last year, similar to where it is this year. Likewise, while the percentage of U.S. adults saying they are spending more (28%) showed no significant change from last year, it is greatly improved from its 2009 and 2010 low of 17%.
To some extent, America's reliable impulse to report "spending less" may partially be the result of social or moralistic pressures that compel some individuals to portray an image of thriftiness, though this may not accurately reflect their behavior. Along those lines, Gallup has repeatedly found that majorities of Americans say they personally prefer saving over spending by a wide margin.
Meanwhile, the share of U.S. adults saying they are spending the same amount of money has shown the least amount of volatility over this period, suggesting a sizable portion of the country has steady financial habits that are at least somewhat removed from larger economic forces.
In line with these findings, Gallup found that monthly spending data for March was essentially equal to that of March 2014.
Americans Who Are Spending Less Continue to Say It's Their "New Normal"
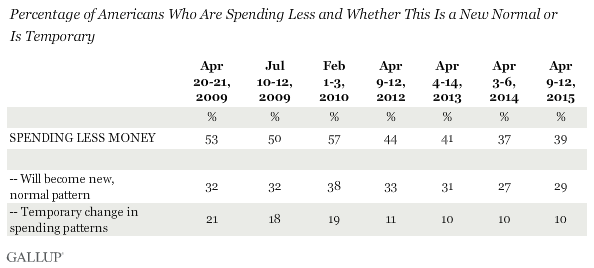
Consistent with previous years, more Americans who say they are spending less estimate that this will become a "new, normal pattern" for them as opposed to a temporary change. In total, nearly three in 10 Americans (29%) say they are spending less money and that this will become a new, normal pattern, while another 10% say they are spending less because of a temporary change in spending patterns. These responses together make up the 39% who say they are spending less. Since 2012, those who say they are cutting back and expect it to be their new normal outnumber those who are cutting back and expect it to be temporary by roughly 3 to 1.

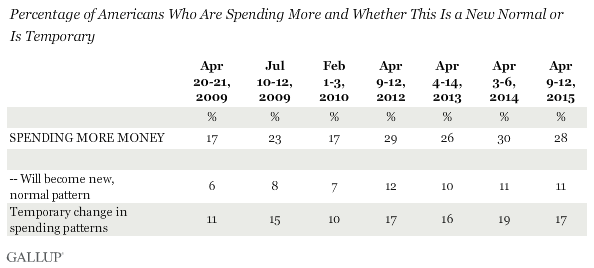
Conversely, a higher proportion of Americans report spending more money for temporary reasons (17%) than say their higher spending will become a new, normal pattern (11%).

Bottom Line
Americans' spending patterns have remained remarkably stable over the past several years, even as the economic recovery has strengthened and the unemployment rate has fallen. Interestingly, the considerable drop in gas prices from one year ago has not translated into an upswing in the percentage of Americans saying they are spending less on what they see as a temporary basis. In March 2014, the average price of gas per gallon in the U.S. was $3.55; last month, that stood at $2.45. But while the year-over-year change in gas prices has been dramatic, on a monthly basis, the price has increased slightly for the past three months in 2015. It may be that the gradual climb in the cost of gas is already eroding Americans' capacity to save, even if the price is well below where it was a year ago.
Survey Methods
Results for this Gallup poll are based on telephone interviews conducted April 9-12, 2015, with a random sample of 1,015 adults, aged 18 and older, living in all 50 U.S. states and the District of Columbia. For results based on the total sample of national adults, the margin of sampling error is ±4 percentage points at the 95% confidence level. All reported margins of sampling error include computed design effects for weighting.
Each sample of national adults includes a minimum quota of 50% cellphone respondents and 50% landline respondents, with additional minimum quotas by time zone within region. Landline and cellular telephone numbers are selected using random-digit-dial methods.
View survey methodology, complete question responses, and trends.
Learn more about how Gallup Poll Social Series works.

