Story Highlights
- Nationally, 72.6% say housing is ideal
- Dayton, Ohio, residents least likely to say home is ideal
- Perceptions of living in ideal home linked to higher well-being
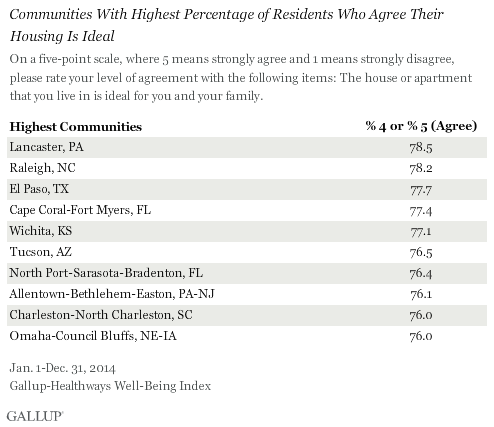
WASHINGTON, D.C. -- Residents of Lancaster, Pennsylvania, (78.5%) and Raleigh, North Carolina, (78.2%) are the most likely adults in the 100 most populous U.S. metropolitan areas to agree that their house or apartment is ideal for them and their family. El Paso, Texas; Fort Myers, Florida; and Wichita, Kansas, round out the top five communities where residents are most likely to agree their housing situation is ideal.

These findings are based on interviews conducted throughout 2014 as part of the Gallup-Healthways Well-Being Index. Americans were asked to use a five-point scale -- where 5 means strongly agree and 1 means strongly disagree -- to rate their level of agreement with the following statement: The house or apartment that you live in is ideal for you and your family.
Housing needs and what qualifies as an "ideal house" can vary widely across the country and from family to family. Many factors beyond cost affect how individuals view their house or apartment, such as size, location, proximity to public transportation and neighborhood safety. Therefore, residents' ratings of their own homes are important measures for community leaders to use when assessing how local housing matches residents' needs.
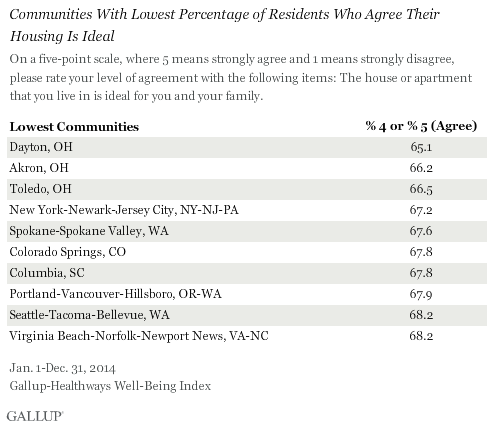
Nationally, 72.6% of Americans in 2014 agreed that their housing is ideal, responding with a rating of 4 or 5. Meanwhile, 12.6% disagreed, responding with a rating of 1 or 2. Across the 100 largest metropolitan areas, residents' agreement that their house or apartment is ideal ranges somewhat narrowly between 65.1% and 78.5%.
Dayton, Ohio, Residents Least Likely to Say Their Housing Is Ideal
Residents of Dayton, Ohio, (65.1%) are the least likely to say their housing is ideal. Two other Ohio communities, Akron and Toledo, also ranked among the five metro areas where residents are least likely to say their housing is ideal, as does Spokane, Washington. The New York City metro area, infamous for expensive housing, also lags behind in residents' perceptions of their house or apartment being ideal at 67.2%.

Still, even in these lower-ranking communities, around two in three residents say their home is ideal for their family.
Perceptions of Ideal Housing Tied to Higher Well-Being
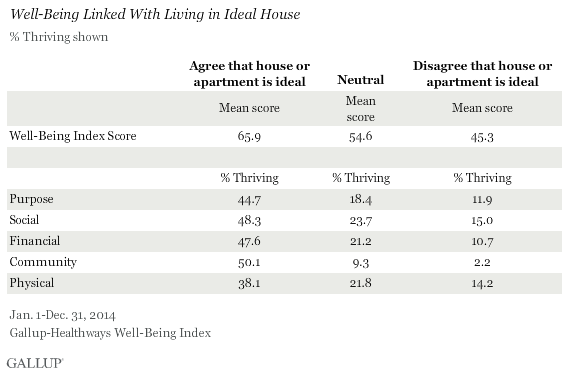
Americans who agree that their house or apartment is ideal have higher overall well-being than those who disagree that their housing is ideal. The average Well-Being Index score among those who say their housing is ideal is 65.9 out of a possible 100, significantly higher than the 54.6 found among those who are neutral and the 45.3 recorded among those who disagree.

It is to be expected that the ideal housing measure is closely linked to the broader element of which it is a part -- community well-being. However, those who report that their housing is ideal are also significantly more likely to have a stronger sense of purpose, a thriving social life, financial security and physical health than those who are not in ideal housing. This underscores the degree to which there is interplay among the various elements of well-being, and when scores in one element are strong, they likely will be strong in other elements as well.
While the relationship between housing perceptions and the four elements of well-being outside of community well-being is strong, the direction of the relationship is unclear. Americans who are thriving in their financial well-being may be better able to find a house or apartment that satisfies their housing needs and desires. But it is also possible that those living in optimal housing are better able to achieve high purpose, social, financial and physical well-being because they are able to feel comfortable and safe when they are home.
Bottom Line
A number of factors can influence residents' perceptions of whether or not they live in an ideal home for them and their family. The size and price of a home, its location and other factors like a big yard or wheelchair accessibility could all influence whether or not residents perceive their house or apartment as ideal.
It is encouraging that, despite vast differences in Americans' means to purchase or rent a home, a majority of residents in all of the U.S. communities that Gallup and Healthways have studied say that their own home is ideal for them.
The data also reveal that Americans in ideal housing are more likely to have high well-being than those who are not in ideal housing. And while this doesn't prove that ideal housing leads to high well-being in other areas, the link is strong enough that satisfaction with housing may contribute at least a little, making ideal housing a goal worth pursuing.
Survey Methods
Results are based on telephone interviews conducted as part of the Gallup-Healthways Well-Being Index survey Jan. 2-Dec. 29, 2014, with a random sample of 176,702 adults, aged 18 and older, living in metropolitan areas in the 50 U.S. states and the District of Columbia, selected using random-digit-dial sampling. Unlike previous years, only the 100 most populous metros -- as determined by the U.S. Census Bureau -- were reported in 2014. A second requirement is that at least 300 cases are required per metro area for reporting. As such, McAllen-Edinburg-Mission, Texas, and Durham-Chapel Hill, North Carolina, were both excluded from reporting because of insufficient sample size. These were replaced by the 102nd-largest metropolitan statistical area (MSA) in the U.S.: Lancaster, Pennsylvania.
The "communities" referenced in this article are based on MSAs as defined by the U.S. Office of Management and Budget. In many cases, more than one city is included in the same MSA. The San Jose, California, MSA, for example, also includes the smaller nearby cities of Sunnyvale and Santa Clara, in addition to San Jose. Each respondent is attributed to his or her MSA based on self-reports of his or her ZIP code.
Maximum margins of error for the Well-Being Index and the element scores vary according to MSA size, ranging from less than one point for the largest cities represented to around ±1.5 points for many of the smallest cities.
All reported margins of sampling error include computed design effects for weighting.
Each sample of national adults includes a minimum quota of 50% cellphone respondents and 50% landline respondents, with additional minimum quotas by time zone within region. Landline and cellular telephone numbers are selected using random-digit-dial methods.
Learn more about how the Gallup-Healthways Well-Being Index works.

