
Story Highlights
- Uninsured rate lowest to date in Gallup and Healthways tracking
- Sharpest declines found among minorities and lower-income adults
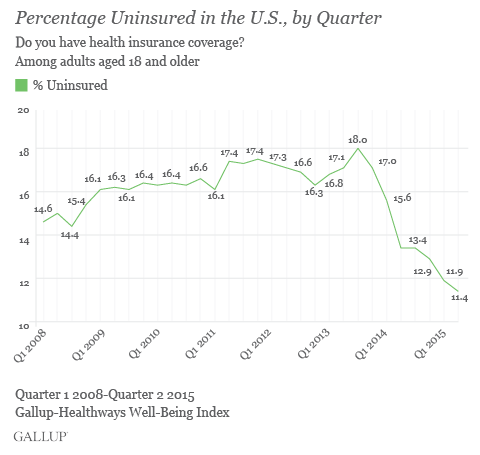
WASHINGTON, D.C. -- The uninsured rate among U.S. adults aged 18 and older was 11.4% in the second quarter of 2015, down from 11.9% in the first quarter. The uninsured rate has dropped nearly six percentage points since the fourth quarter of 2013, just before the requirement for Americans to carry health insurance took effect. The latest quarterly uninsured rate is the lowest Gallup and Healthways have recorded since daily tracking of this metric began in 2008.
The second-quarter results are based on approximately 44,000 interviews with U.S. adults from April 1 to June 30, 2015, conducted as part of the Gallup-Healthways Well-Being Index. Gallup and Healthways ask 500 U.S. adults each day whether they have health insurance, which on an aggregated basis allows for precise and ongoing measurement of the percentage of Americans with and without health insurance.
Gallup's monthly trend indicates that the decline in the uninsured rate took place late in the first quarter -- after the Feb. 15 deadline to purchase health insurance -- and that the lower rate held steady throughout the second quarter. The uninsured rate fell to 11.3% by March, and the April, May and June averages were similar.
Uninsured Rate Declines Sharply Among Minorities and Lower-Income Americans
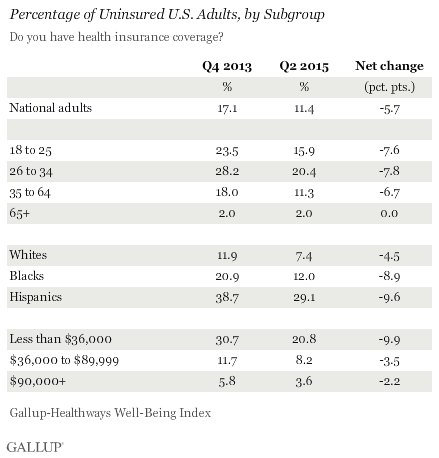
From a long-range perspective, the uninsured rate has declined across nearly all key subgroups since 2013. But the sharpest declines have occurred among Hispanics, blacks and lower-income Americans. The uninsured rate among Hispanics declined by 9.6 points from the fourth quarter of 2013 -- the last full quarter of interviewing before the requirement that Americans carry health insurance took effect. Similarly, the percentage of uninsured blacks dipped 8.9 points over this period. Across major subgroups, those making less than $36,000 in annual household income have seen the sharpest drop -- 9.9 points since the fourth quarter of 2013.
More Americans Have Self-Funded Health Plans
To assess changes in insurance type, Gallup and Healthways focus only on those adults aged 18 to 64, given that most Americans aged 65 and older are on Medicare. The percentage of 18- to 64-year-olds who are covered through a plan fully paid for by themselves or a family member was 20.9% in the second quarter, up from 17.6% in the fourth quarter of 2013. Similarly, 9.5% of 18- to 64-year-olds had Medicaid coverage last quarter, up from 6.9% in the final quarter of 2013. The increase in the percentage covered through Medicaid is likely due to the healthcare law provision that expanded the qualifying income levels for Medicaid.
Just under half of 18- to 64-year-olds in the U.S. (43.4%) have health insurance through a current or former employer -- a percentage that has stayed relatively stable since the fourth quarter of 2013.
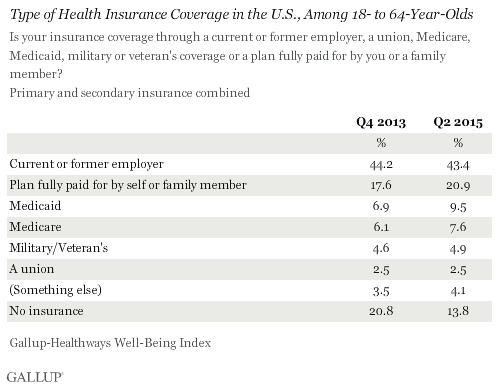
Gallup and Healthways began asking about the source of health insurance using the current question wording in August 2013 in anticipation of shifts in insurance type as a result of the Affordable Care Act. Respondents are asked, "Is your primary health insurance coverage through a current or former employer, a union, Medicare, Medicaid, military or veteran's coverage or a plan fully paid for by you or a family member?" Respondents are also asked if they have secondary health insurance coverage, and if so, what type of coverage. The results reported here are a combined estimate of primary and secondary insurance types.
Implications
The 2015 second-quarter uninsured rate is the lowest rate measured since Gallup and Healthways began tracking the metric at the start of 2008, raising the question of how low the rate can go. Recently, the Supreme Court ruled in the case of King v. Burwell to affirm the legality of subsidies provided to those obtaining insurance through the Affordable Care Act via a federal or state exchange. The case represents the second attempt to challenge components of the healthcare law since its implementation, and is a major victory for the law's supporters. Had the Supreme Court ruled differently, the decision would have greatly undermined the Affordable Care Act and likely spurred major changes in the healthcare system -- and by extension, the percentages of Americans who are insured and uninsured.
Enrollment for 2016 coverage begins Nov. 1, 2015. The uninsured rate may decline again slightly, although less significantly than it did over this past year, as those who remain uninsured are likely the hardest to engage.
Survey Methods
Results are based on telephone interviews conducted April 1-June 30, 2015, as part of the Gallup-Healthways Well-Being Index survey, with a random sample of 43,575 adults, aged 18 and older, living in all 50 U.S. states and the District of Columbia. For results based on the total sample of national adults, the margin of sampling error is ±1 percentage point at the 95% confidence level. Each quarter dating to Quarter 1, 2014, has approximately 44,000 respondents. Each quarter from 2008 through 2013 has approximately 88,000 respondents.
Each sample of national adults includes a minimum quota of 50% cellphone respondents and 50% landline respondents, with additional minimum quotas by time zone within region. Landline and cellular telephone numbers are selected using random-digit-dial methods.
Learn more about how the Gallup-Healthways Well-Being Index works.