Story Highlights
- Two in 10 Americans report they include soda in their diet
- Little difference between choices of regular soda or diet
- Large change in Americans avoiding soda since 2002
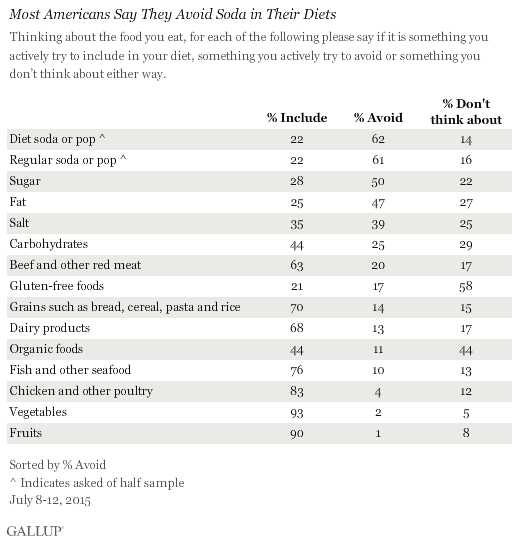
WASHINGTON, D.C. -- Americans are more likely to say they actively try to avoid including soda or pop in their diet than 14 other foods, including sugar and fat. At least six in 10 U.S. adults say they are trying to steer clear of these drinks -- regardless of whether they are diet or regular.

Americans are most likely to say they actively try to include fruits and vegetables in their diet. Gallup asked 1,009 Americans about the foods they try to include or avoid in their diet as part of its annual Consumption Habits poll in July. Previous Gallup reports have focused on Americans' avoidance or inclusion of gluten-free foods and salt or fat.
Americans appear to be aware of the health benefits of fruits and vegetables, with at least nine in 10 saying they actively try to include each in their diet. At least three in four Americans also say they try to include chicken and fish in their diet, meats that nutrition experts often recommend to help with heart health, in lieu of beef and other red meat -- which nevertheless, 63% of Americans still actively try to include in their diet.
In 2015, there are only three types of food that 50% or more of Americans say they actively try to avoid -- diet and regular soda and sugar. Historically, Gallup has asked Americans generally about their intake of "soda or pop," but in this year's poll, Gallup asked half of those surveyed about "diet soda or pop" and asked the other half about "regular soda or pop." It appears that Americans don't distinguish between the two, despite the higher sugar and calorie content in regular soda than in diet soda. The results were nearly identical, with 61% reporting they try to avoid regular soda and 62% diet soda.
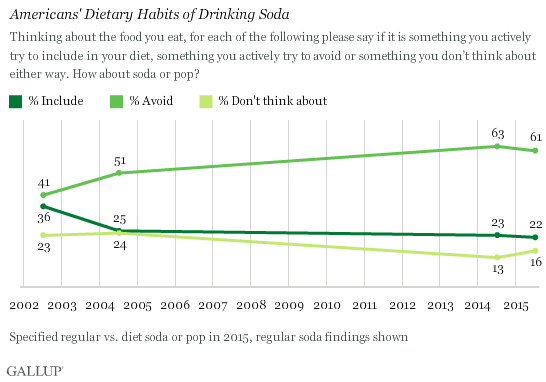
Regardless of question wording, Americans' attitudes toward including soda in their diet are unchanged since last year. But Americans are far more likely now (61%) than in 2002 (41%) to say they are trying to avoid soda. Likewise, the percentage of Americans who actively include soda in their diet has dropped since 2002, although not as drastically, from 36% to 22%.

Americans have also become more likely to report avoiding sugar, from 43% in 2002 to 50% in 2015 -- although this change is less pronounced than the change in attitudes about soda. Americans' likelihood to either include or avoid fruits, vegetables, chicken, fish or red meat has been largely stable since 2002.
Bottom Line
Americans appear to be aware of the health benefits of eating fruits, vegetables and lean meats such as chicken and fish, with the vast majority of Americans reporting they try to include them in their diet. However, Americans do not always achieve this goal, with 57.7% reporting they had five or more servings of fruits and vegetables at least four days of the last week in 2013.
A majority of Americans report they try to avoid drinking soda, regardless of whether it is regular or diet. This is a drastic change from just over a decade ago. Consumers may say they are trying to avoid soda because of the high-calorie and high-sugar content in regular soda, or the fears of artificial sweeteners used in diet soda. While some doctors agree that a can or two of soda a day isn't harmful to one's health, most advise that lower-calorie and natural beverages, such as skim milk or water, may be healthier choices.
Historical data on these items are available in Gallup Analytics.
Survey Methods
Results for this Gallup poll are based on telephone interviews conducted July 8-12, 2015, with a random sample of 1,009 adults, aged 18 and older, living in all 50 U.S. states and the District of Columbia. For results based on the total sample of national adults, the margin of sampling error is ±4 percentage points at the 95% confidence level. All reported margins of sampling error include computed design effects for weighting.
Each sample of national adults includes a minimum quota of 50% cellphone respondents and 50% landline respondents, with additional minimum quotas by time zone within region. Landline and cellular telephone numbers are selected using random-digit-dial methods.
View complete question responses and trends.
Learn more about how Gallup Poll Social Series works.

