Story Highlights
- Spending for August down slightly compared with '13 and '14
- Historically, spending averages usually decrease in September
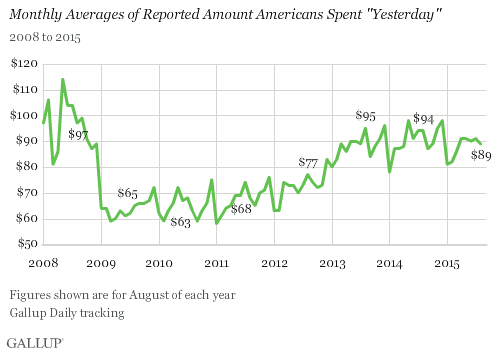
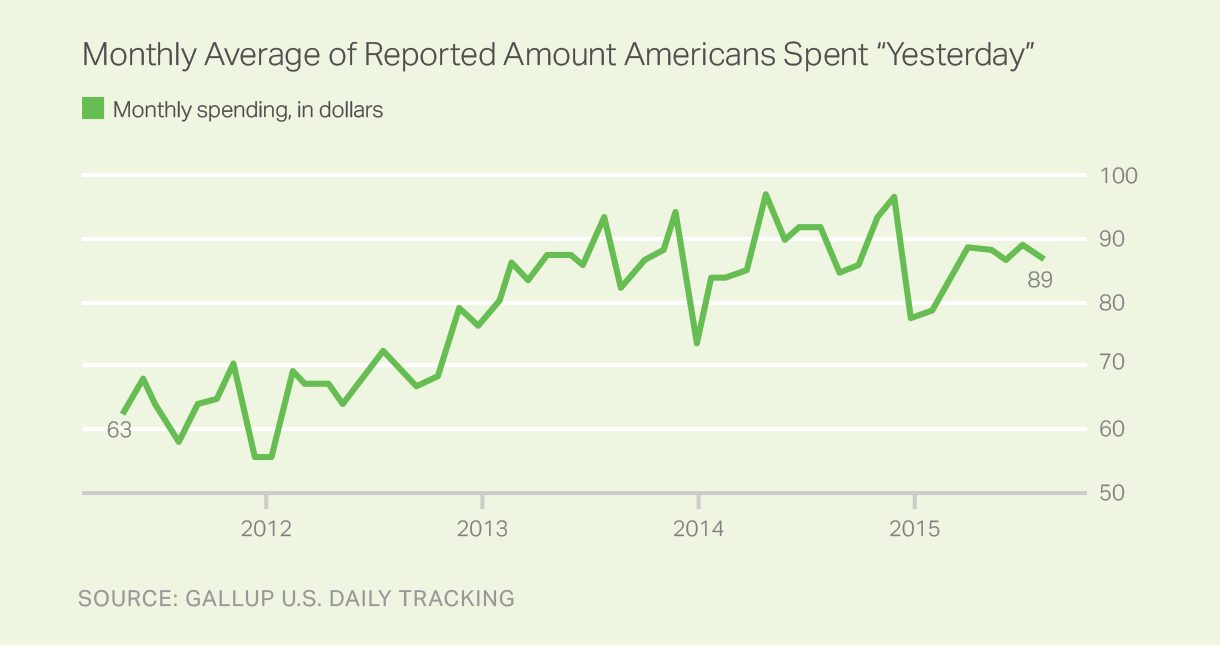
WASHINGTON, D.C. -- Americans' self-reported daily spending averaged $89 in August, similar to the $90 to $91 averages Gallup has found each month since April. The latest figure is the lowest August reading since 2012.

Gallup's daily spending measure asks Americans to estimate the total amount they spent "yesterday" in restaurants, gas stations, stores or online -- not counting home, vehicle or other major purchases, or normal monthly bills -- to provide an indication of Americans' discretionary spending. The average for August 2015 is based on Gallup Daily tracking interviews with more than 15,000 U.S. adults.

Spending peaked at $114 in May 2008 before waning and then plunging amid the global economic crisis that took hold later in the year. From 2009 to 2012, spending stagnated, ranging between $58 and $83. Americans' spending picked up in late 2012, and continued in 2013 and 2014, ranging from $78 to $98. Averages for 2015 have ranged from $81 to $91.
September May Not Yield Spending Boost, as Per Recent History
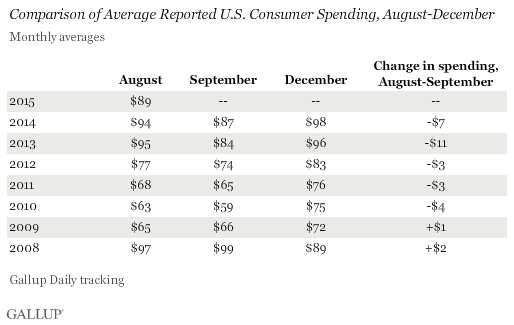
If monthly spending patterns in recent years are any indication of what is to come, spending is not likely to increase in September. In each of the previous five years, spending in September has been lower than in August, including sharp declines of $11 in 2013 and $7 in 2014. In 2008 and 2009, it increased slightly, but only by a dollar or two.
Regular declines in spending from August to September are understandable given the end of the vacation season and the end of back-to-school shopping, one of the busiest times of the year for retailers.
By contrast, spending typically booms at the end of the year. In each year except for 2008, spending averages increased -- often by double digits -- between September and December.

Bottom Line
Though down slightly, Americans' spending remains in somewhat of a holding pattern, having stayed within a $2 range for the last five months. But while the average for August is on par with recent months, it remains below averages recorded for August in 2013 and 2014.
Spending typically has declined from August to September, including sharp declines seen the last two years. It is hard to know if there will be a similar decline this September, given that August spending was lower in 2015 than in 2013 and 2014. A later Labor Day holiday could extend the typical summer vacation and back-to-school shopping seasons, with some of that usual August spending being shifted to September this year.
Survey Methods
Results for this Gallup poll are based on telephone interviews conducted Aug. 1-31, 2015, on the Gallup U.S. Daily survey, with a random sample of 15,724 adults, aged 18 and older, living in all 50 U.S. states and the District of Columbia. For results based on the total sample of national adults, the margin of sampling error is ±1 percentage point at the 95% confidence level. The margin of error for the spending mean is ±$4. All reported margins of sampling error include computed design effects for weighting.
Each sample of national adults includes a minimum quota of 50% cellphone respondents and 50% landline respondents, with additional minimum quotas by time zone within region. Landline and cellular telephone numbers are selected using random-digit-dial methods.
Learn more about how the Gallup U.S. Daily works.
