Story Highlights
- 35% rate airline industry positively and 32% negatively
- Industry has had net positive ratings since 2013
- Industry viewed negatively from 2007-2012
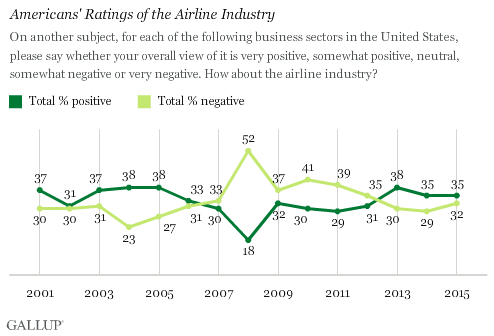
WASHINGTON, D.C. -- Americans continue to view the airline industry slightly more positively than negatively, despite the frequent news reports about increased airline fees, cramped seats and customer frustration. The industry's current positive ratings are consistent with what Gallup has found since 2013 and with ratings before the economic downturn. From 2007 through 2012, as was true for many industries, more Americans viewed the airline industry negatively than positively.

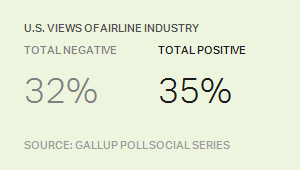
Gallup annually asks Americans to rate the airline industry, as well as 24 other business industries and sectors, as part of its August Work and Education poll. Americans rate each industry on a five-point scale ranging from very positive to very negative. The airline industry has a net +3 positive rating this year, based on a combined 35% rating it very positively or positively, and 32% rating it very negatively or negatively. This rating ranks in the bottom third of the industries this year.

The favorability of the airline industry has fluctuated over the years. In 2008, when many industries saw their ratings drop as the economy was in recession, positive ratings of the airline industry fell sharply from 30% to 18%. At that time, record-high gas prices and lower consumer travel expenditures forced airlines to introduce additional fees, increase prices and layoff employees. The resulting negative press, together with Americans' souring attitudes on most industries in 2008, at least partly explains this large net negative rating of -34 at that time. The industry continued to have a net negative rating until 2013, but by a narrower margin.
Younger More Likely Than Older Americans to View Airline Industry Positively
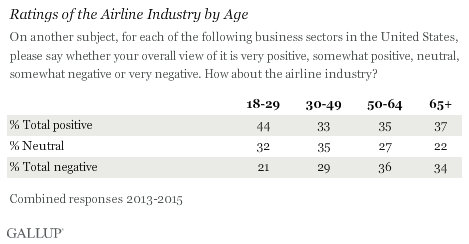
Young adults, those aged 18 to 29, are more likely than older Americans to view the airline industry positively. Based on combined data from 2013 through 2015, 44% of Americans aged 18 to 29 had a positive view of the industry, compared with fewer than four in 10 in all other age groups.

Younger Americans' more positive views of the airline industry could be attributed to the fact that drastic changes in the industry's history occurred before they were born. No one in this age group was alive before airlines were deregulated in 1978. This move, which was supposed to make air travel less expensive, is what introduced more fees, the bankruptcy of many small airports and several airline mergers. Furthermore, the youngest Americans also became adults and began flying more after airport changes following the Sept. 11 terrorist attacks.
Bottom Line
In early 2015, the U.S. Department of Justice announced it was investigating four of the major U.S. airlines for potential and "unlawful coordination" over prices, routes and fees between the airlines. If this did occur among these airlines, it could have hurt consumers by limiting competition and the availability of options between the airlines. Adding to customer complaints in 2015, oil and gas prices are down significantly, but the prices of tickets for flights have remained high.
However, the negative conditions taken as a whole -- including mergers, changes in pricing structure, additions of fees and other shifts in the customer flying experience -- have apparently not resulted in a significant degradation of the airline industry's image. Americans have been as likely to view the industry positively as negatively over the past several years, and these perceptions are as positive as they have been for a decade.
Historical data are available in Gallup Analytics.
Survey Methods
Results for this Gallup poll are based on telephone interviews conducted Aug. 5-9, 2015, with a random sample of 1,011 adults, aged 18 and older, living in all 50 U.S. states and the District of Columbia.
Each industry was rated by a random subset of approximately 500 respondents. The margin of sampling error is ±6 percentage points at the 95% confidence level. For results based on the total sample of 270 18- to 29-year-olds, the margin of sampling error is ±8 percentage points at the 95% confidence level. All reported margins of sampling error include computed design effects for weighting.
Each sample of national adults includes a minimum quota of 50% cellphone respondents and 50% landline respondents, with additional minimum quotas by time zone within region. Landline and cellular telephone numbers are selected using random-digit-dial methods.
View survey methodology, complete question responses and trends.
Learn more about how Gallup Poll Social Series works.
