Story Highlights
- Averages of self-reported daily spending stable since April
- Amount consistent with same month in 2014, higher than 2009-2013
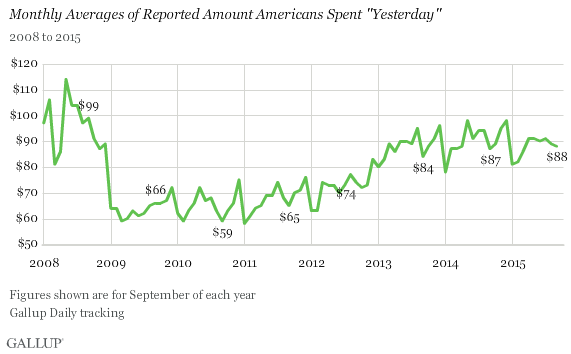
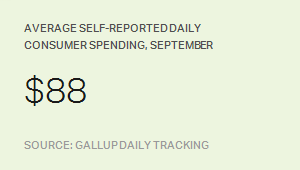
WASHINGTON, D.C. -- Americans' daily self-reports of spending averaged $88 in September, essentially the same as the $89 found in August. Spending has been fairly consistent since April, hovering around $90.

The current figure is similar to the $87 found in September 2014, but is higher than the September averages from 2009 through 2013, which were all below $85. Gallup has not found a consistent pattern in spending changes from September to October. But spending tends to increase in November as the holiday shopping season begins.

From a broader perspective, average spending has been higher since 2013 than it was from 2009-2012. Gallup began tracking spending in 2008, and in the early months of that year spending was higher than it has been at any point since, a benchmark that has yet to be reached in the current recovery environment.
Bottom Line
Consumer spending in the U.S. has been fairly stable since April of this year, and going by previous years, it is likely to stay in this range until the start of the holiday shopping season.
But developments in the U.S. economy could change that. In particular, the September jobs report released by the U.S. Bureau of Labor Statistics on Friday fell short of expectations. The 3rd quarter GDP report to be released in late October may also influence Americans' perceptions of the strength of the U.S. economy, potentially influencing their spending choices. Gallup has found Americans have been a bit more positive about their finances thus far in 2015 compared with prior years and that, too, could affect their willingness to spend.
These data are available in Gallup Analytics.
Survey Methods
Results for this Gallup poll are based on telephone interviews conducted Sept. 1-30, 2015, on the Gallup U.S. Daily survey, with a random sample of 14,704 adults, aged 18 and older, living in all 50 U.S. states and the District of Columbia. For results based on the total sample of national adults, the margin of sampling error is ±1 percentage points at the 95% confidence level. The margin of error for the spending mean is ±$4. All reported margins of sampling error include computed design effects for weighting.
Each sample of national adults includes a minimum quota of 60% cellphone respondents and 40% landline respondents, with additional minimum quotas by time zone within region. Landline and cellular telephone numbers are selected using random-digit-dial methods.
Learn more about how Gallup Daily tracking works.
