Story Highlights
- Index averaged -14 in September; unchanged from August
- Weekly averages in September ranged from -14 to -12
- Americans' outlook for the economy remains pessimistic
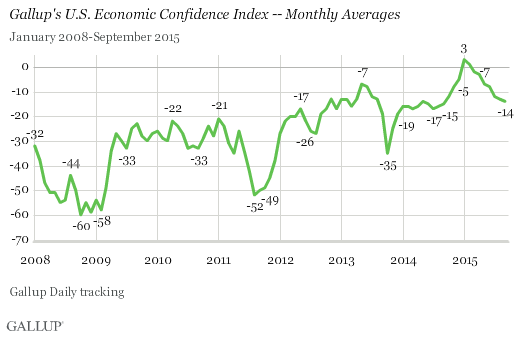
WASHINGTON, D.C. -- Gallup's U.S. Economic Confidence Index averaged -14 for September, essentially the same as the -13 in August. From a broader perspective, the index has declined steadily since peaking at +3 in January.

Weekly averages for the Economic Confidence Index have remained below -10 since early July. The weekly index fell to -17 in the last week of August amid volatile international and domestic market conditions, and has averaged between -12 and -14 since. The latest weekly average, for the week ending Oct. 4, is -13.

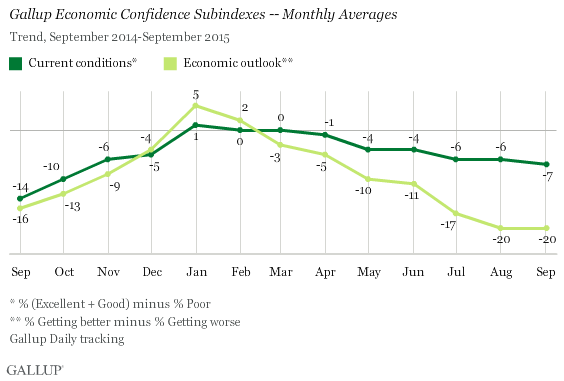
Gallup's Economic Confidence Index is the average of two components: how Americans rate the current economy and if they feel the economy is improving or getting worse. In September, both components were steady compared with August.
Twenty-four percent of Americans rated the current economy as "excellent" or "good," while 31% rated it as "poor." This results in a current conditions score of -7.
Thirty-eight percent of Americans said the economy is "getting better," while 58% said it is "getting worse." This results in an economic outlook score of -20. The economic outlook score has trailed the current conditions score since March.

Bottom Line
After a downward trend that started in February, Americans' confidence in the economy in September hovered at its lowest point in a year. There has been a fair share of negative economic news in the past few months, including the late-summer drop in the stock market and the government's recent disappointing jobs report. However, at the same time, the price of gas remains lower now than at this time last year. Gallup's other economic measures are showing mixed tendencies, with an increase in the percentage of Americans who say now is a good time to find a quality job, but a fairly flat pattern of consumer spending.
These data are available in Gallup Analytics.
Survey Methods
Results for this Gallup poll are based on telephone interviews conducted Sept. 1-30, 2015, on the Gallup U.S. Daily survey, with a random sample of 14,684 adults, aged 18 and older, living in all 50 U.S. states and the District of Columbia. For results based on the total sample of national adults, the margin of sampling error is ±1 percentage point at the 95% confidence level. All reported margins of sampling error include computed design effects for weighting.
Each sample of national adults includes a minimum quota of 60% cellphone respondents and 40% landline respondents, with additional minimum quotas by time zone within region. Landline and cellular telephone numbers are selected using random-digit-dial methods.
Learn more about how Gallup Daily tracking works.
