Story Highlights
- Americans plan to spend an average of $830 on gifts this season
- Estimate is up sharply from $720 a year ago at this time
- Increase points to solid holiday retail sales
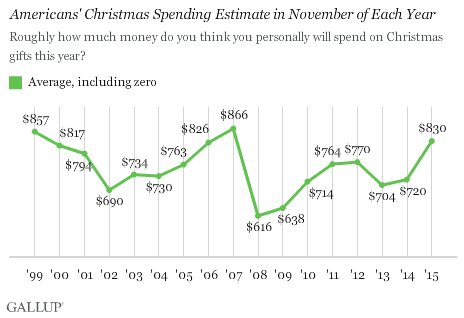
PRINCETON, N.J. -- Gallup's November update of Americans' 2015 holiday spending intentions finds U.S. adults planning to spend $830 on Christmas gifts this year, on average. That is up sharply from the $720 recorded a year ago, and is significantly higher than what consumers have indicated in any November since 2007.
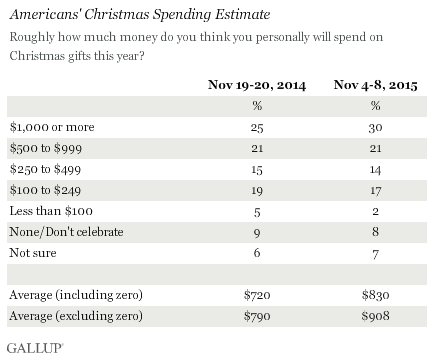
According to the Nov. 4-8 poll, 30% of U.S. adults expect to spend $1,000 or more on gifts, slightly higher than the 25% in the top-spender category a year ago. About one in five will spend between $500 and $999, 14% will spend between $250 and $499, and 19% will spend less than $250. Just 8% say they don't celebrate Christmas or won't be spending anything, while 7% are unsure how much they will spend.
Although the average amount all Americans expect to spend is $830, the figure rises to $908 when excluding those who won't spend anything -- or, in other words, when limited to U.S. Christmas shoppers.
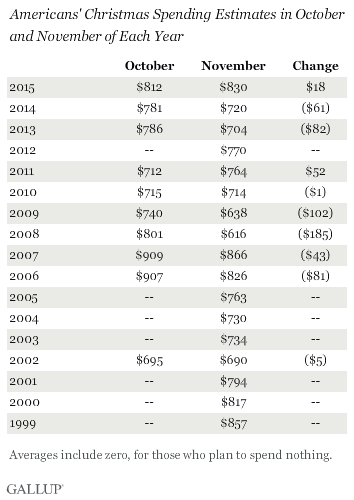
Gallup's initial measure of 2015 holiday spending plans, conducted in October, also showed consumers poised to splurge this Christmas, as that month's $812 average spending figure was the highest Gallup had seen in any October since 2007. The consistency between the two months is a bit unusual, as Gallup typically finds Americans scaling back their spending plans between October and November.
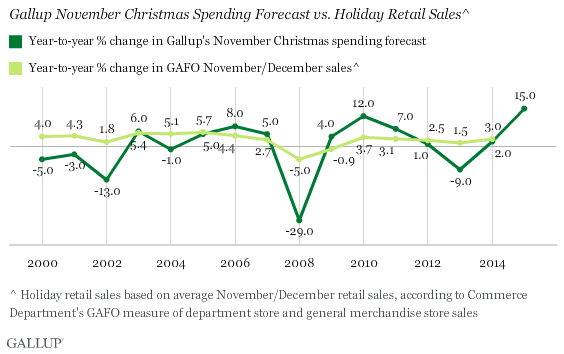
According to Gallup's modeling of how prior years' spending forecasts compare with the final November-December retail sales figures for each year, Americans' latest Christmas spending data point to an estimated increase of between 5.1% and 5.8% in U.S. holiday retail sales. This forecast is based on historical comparisons of Gallup November spending estimates to the U.S. Census Bureau's GAFO (General Merchandise, Apparel and Accessories, Furniture and Other Sales) retail sales estimates.
Even at the low end, the predicted range of increased holiday spending would be a considerable improvement over the past decade, when retail sales increases have had a hard time exceeding 3%, and even decreased during the worst of the 2007-2009 economic slump.
Christmas spending intentions vary greatly by household income. Americans living in households earning $75,000 or more per year plan to spend an average of $1,227 on Christmas gifts this season. This drops to $786 among middle-income earners and to $460 among those earning less than $30,000.
Estimated Christmas spending is also higher among households with children younger than 18 living at home than among those without children at home: $1,092 versus $706.
Bottom Line
Regardless of whether Americans follow through with their higher spending intentions, the fact that they are in the mood to do so is a positive sign for the nation's retailers at the end of a slow year. Until now, overall consumer spending has been rather anemic according to U.S. Commerce Department data, typically rising by not much more than 1% in any month this year. However, the latest available GAFO data from September -- which are more indicative of the types of purchases Americans make at Christmas -- showed an increase of 2.4%. If that holds in the October report, an increase of 5% or more by November and December may not be unreasonable, particularly in light of continued lower gas prices.
Survey Methods
Results for this Gallup poll are based on telephone interviews conducted Nov. 4-8, 2015, with a random sample of 1,021 adults, aged 18 and older, living in all 50 U.S. states and the District of Columbia. For results based on the total sample of national adults, the margin of sampling error is ±4 percentage points at the 95% confidence level. The margin of sampling error for the average Christmas spending estimate is ±$63 at the 95% confidence level.
Each sample of national adults includes a minimum quota of 60% cellphone respondents and 40% landline respondents, with additional minimum quotas by time zone within region. Landline and cellular telephone numbers are selected using random-digit-dial methods.
View complete question responses and trends.
Learn more about how the Gallup Poll Social Series works.


