Story Highlights
- Economic confidence averaged -13 in November
- Monthly confidence steady since July
- Democrats continue to have highest economic confidence
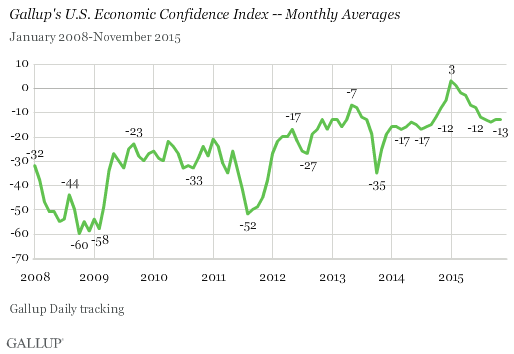
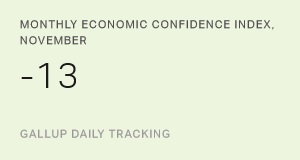
WASHINGTON, D.C. -- Gallup's Economic Confidence Index averaged -13 in November, similar to the monthly averages since July. This is down noticeably from +3 in January, the highest monthly average Gallup has found since 2008, and in recent months has settled close to where it was in the first half of last year. November's confidence level, however, remains higher than most monthly averages found between 2008 and 2013.

For the week of Nov. 23-29, the index averaged -12, also similar to what has been found most weeks since July.
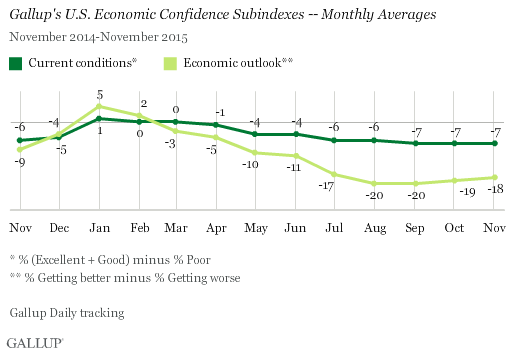
Gallup's Economic Confidence Index is the average of two components: how Americans rate current economic conditions and whether they feel the economy is improving or getting worse. The overall drop in economic confidence has been driven to a large degree by the significant drop in the latter -- Americans' views of the future of the economy -- rather than their views of current economic conditions. Both components were unchanged in November and are similar to where they have been since July.

In November, 24% of Americans rated current economic conditions as "excellent" or "good," while 31% rated current conditions as "poor." This resulted in a current conditions score of -7. Meanwhile, the economic outlook score was much lower, at -18. This was the result of 39% of Americans saying the economy is "getting better" and 57% saying it is "getting worse."

Republicans Continue to Have Less Economic Confidence Than Democrats
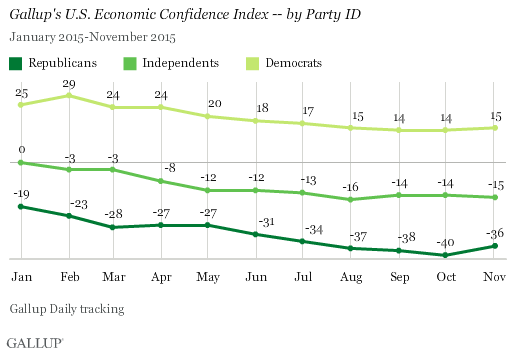
In November, Republicans and independents maintained negative Economic Confidence Index averages, at -36 and -15, respectively. However, Democrats reported a positive average, at +15. All of these readings are consistent with what Gallup has found the past few months, but the November averages among all parties are at least 10 points lower than what was found in January.

Gallup has previously found that economic confidence is strongly tied to political party, with supporters of the president's party more positive. Since Barack Obama took office, Republicans have had much lower confidence than Democrats, though the size of the gap has varied. For example, in November, Democrats and Republicans were 51 points apart, but in January, they were 44.
Bottom Line
Americans' economic confidence has remained flat for a number of months. At this current level, the index has lost the gains seen at the end of last year and the beginning of this year. Much of the loss in confidence reflects an erosion in expectations about the direction of the economy rather than in assessments of current conditions.
Events in December could cause some movement in confidence, including the government's next jobs report, due out Friday, Dec. 4. The Federal Reserve could also raise interest rates, with a decision due Dec. 16. While the Fed may not raise rates by much, many experts do expect interest rates to be raised for the first time in seven years. The decision could also affect stock values, and this sometimes leads to changes in confidence. Finally, strong December holiday spending could help stimulate the economy, potentially increasing confidence. Gallup has predicted greater holiday spending than in recent years, but how much Americans actually spend remains to be seen. And with Americans increasingly shopping online, rather than in stores on days like Black Friday, the final results of Christmas spending likely won't be known until after the holiday.
These data are available in Gallup Analytics.
Survey Methods
Results for this Gallup poll are based on telephone interviews conducted Nov. 1-30, 2015, on the Gallup U.S. Daily survey, with a random sample of 14,161 adults, aged 18 and older, living in all 50 U.S. states and the District of Columbia. For results based on the total sample of national adults, the margin of sampling error is ±1 percentage point at the 95% confidence level. All reported margins of sampling error include computed design effects for weighting.
Each sample of national adults includes a minimum quota of 60% cellphone respondents and 40% landline respondents, with additional minimum quotas by time zone within region. Landline and cellular telephone numbers are selected using random-digit-dial methods.
Learn more about how Gallup Daily tracking works.


