Story Highlights
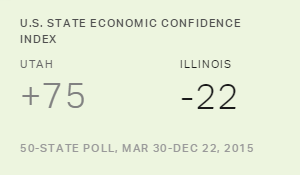
- Utah has +75 state Economic Confidence Index
- Illinois has lowest state confidence index at -22
- In some energy-producing states, outlook is less bright
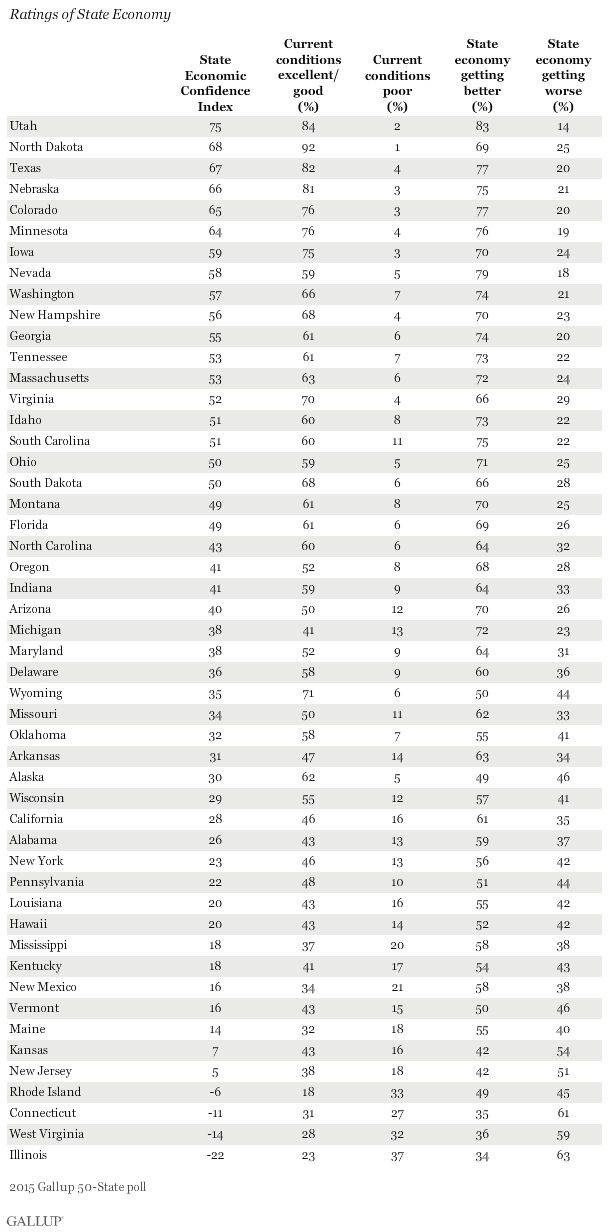
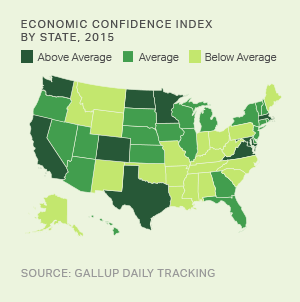
PRINCETON, N.J. -- Residents of the U.S. states show wide variation in their evaluations of their state economies, with Utah residents the most positive and Illinois residents the most negative. Those living in North Dakota, Texas, Nebraska, Colorado and Minnesota are also very positive about economic conditions in their state. Residents of West Virginia, Connecticut, Rhode Island and Illinois are the only ones to evaluate their state economy more negatively than positively.
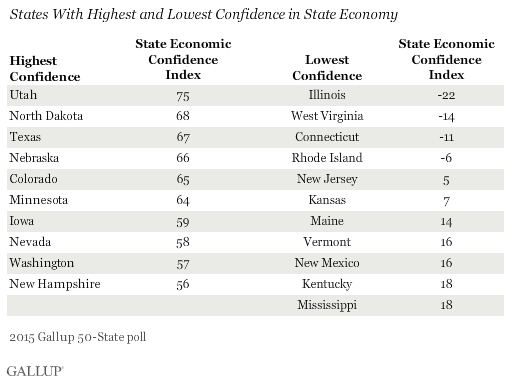
The results are based on Gallup's 50-State poll, conducted March 30-Dec. 22, 2015, with approximately 500 respondents in every state. Full results for each state appear at the end of the article.
Recently, Gallup reported state-by-state evaluations of the national economy, based on aggregated data from Gallup Daily tracking in 2015. The two measures are positively correlated, such that states with higher state economy ratings also have better ratings of the national economy. Minnesota residents were most positive about the national economy and rank among the most positive about their state's economy. West Virginians were least positive about the national economy and rated their state's economy poorly. Utah residents, however, were much more upbeat about their state economy than the national economy, with their ratings of the national economy only in line with the nationwide average.
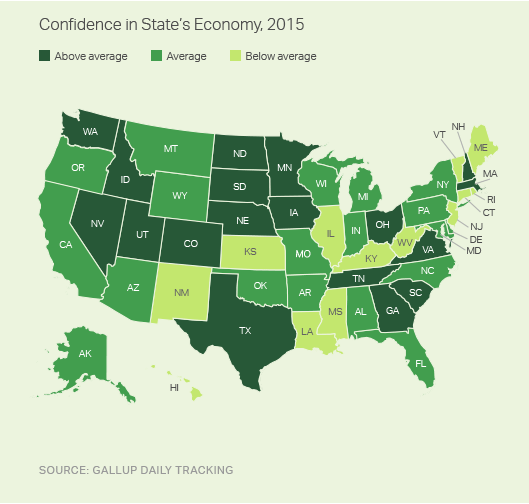
Generally speaking, Americans are much more positive about economic conditions in their state than in the country as a whole. In 46 states, residents were more positive than negative about the state economy last year. By comparison, in only three states -- Minnesota, California and Massachusetts -- were residents more positive than negative about the national economy. Americans often perceive conditions closer to home as better than conditions in the nation as a whole, a pattern that also applies to views on crime, schools and trust in government.
Gallup's Economic Confidence Index has a theoretical range of -100 to +100. A +100 score indicates all respondents rate current economic conditions as excellent or good and say they are getting better. A -100 score indicates all respondents rate current conditions as poor and getting worse. A score of 0 indicates respondents are neutral in their evaluation of the state (or national) economy.
There are no obvious regional patterns in ratings of the 50 state economies. However, five states with below-average ratings of their state economy are in the East, more than in any other region. New Hampshire and Massachusetts are two Eastern states with above-average ratings of their state economy. The Midwest has the largest number of above-average states -- six, one more than in the West and South.
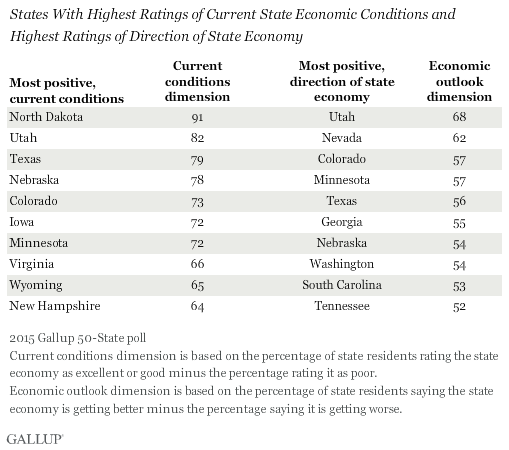
North Dakota Residents Most Positive About Current Conditions
There are two dimensions that make up the Economic Confidence Index, with North Dakota residents most positive about current economic conditions in their state and Utah residents most positive about the direction of their state's economy. More than nine in 10 North Dakotans rate current economic conditions in their state as excellent or good (92%), while just 1% say they are poor, resulting in a current conditions dimension score of +91. Utah is second-most-positive about current conditions, at +82.
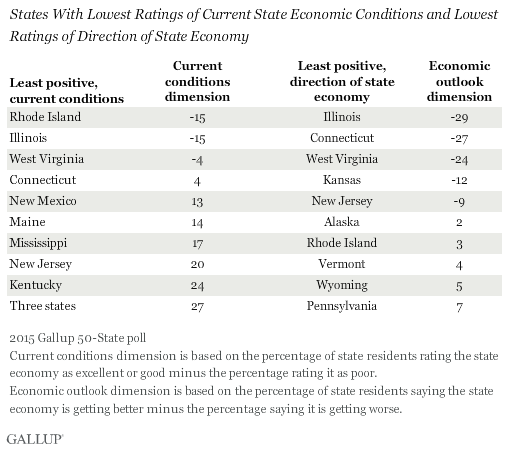
Illinois and Rhode Island tie for the lowest rating of current state economic conditions, at -15. Illinois residents are most negative about the direction of their state's economy, with Connecticut and West Virginia close behind.
Some states show a discrepancy between their ratings of current conditions and their expectations of where the state economy is headed. North Dakota is one of these -- although it has the highest rating of current state economic conditions, it does not rank among the top states in economic outlook, with an outlook score of +45. While still positive overall, North Dakota's outlook score is 46 points lower than its current conditions score, representing one of the widest gaps for any state.
Wyoming and Alaska show even greater disparities in residents' views of the current state economy and where it is headed. In Wyoming, the gap is 60 points, with a +65 rating for current conditions and +5 for economic outlook. Notably, Wyoming ranks among the top 10 states in ratings of current economic conditions, but among the bottom 10 in its residents' belief that their state economy is improving.
In Alaska, the gap between the two ratings is 55 points (+57 for current conditions and +2 for economic outlook).
North Dakota, Alaska and Wyoming are all energy-producing states that are likely being hurt by steep drops in gas and oil prices since late 2014.
Implications
Americans are much more positive about their state economies than they are about the national economy, and in no state are they more positive about their state economy than in Utah. Five other states, mostly in the Midwest, immediately follow Utah. Residents in several energy-producing states are upbeat about the current state of their economy, but harbor doubts about whether the good times will continue.
On the other hand, Illinois, Rhode Island, West Virginia and Connecticut are the four states in which residents are more pessimistic than optimistic about the state economy. Residents' views of the economy in these states are not necessarily just a reflection of how the state is doing economically. For example, West Virginia has one of the higher unemployment rates in the nation, but Illinois, Rhode Island and Connecticut are closer to the national average. And all but West Virginia saw economic growth in the early part of 2015, with Connecticut and Rhode Island growing faster than the national average. Other factors, such as frustration with the government and real or perceived tax burden, may also color the way residents in these states view their state's economy.
Survey Methods
Results for this Gallup poll are based on telephone interviews conducted March 30-Dec. 22, 2015, with random samples of approximately 500 adults, aged 18 and older, living in each of the 50 U.S. states. Data are weighted to account for unequal selection probability, nonresponse and double coverage of landline and cellphone users in the two sampling frames. Data are also weighted to state estimates of gender, age, race, Hispanic ethnicity, education and phone status (cellphone only, landline only, both and cellphone mostly).
For results based on the total sample of adults in each state, the margin of sampling error is ±6 percentage points at the 95% confidence level. All reported margins of sampling error include computed design effects for weighting.
Each state sample includes roughly 60% cellphone respondents and 40% landline respondents. Landline and cellular telephone numbers are selected using random-digit-dial methods.
