Story Highlights
- Economic Confidence Index averages -14, down from -10
- Americans' economic outlook is lowest since November 2013
- All party groups are slightly more negative about economy
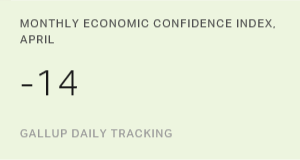
PRINCETON, N.J. -- Americans' confidence in the economy retreated in April, with Gallup's Economic Confidence Index averaging -14 for the month, down from -10 in March. The April average ties with September 2015 as numerically the worst since confidence started climbing toward positive territory in late 2014 and early 2015 after gas prices began to decline.
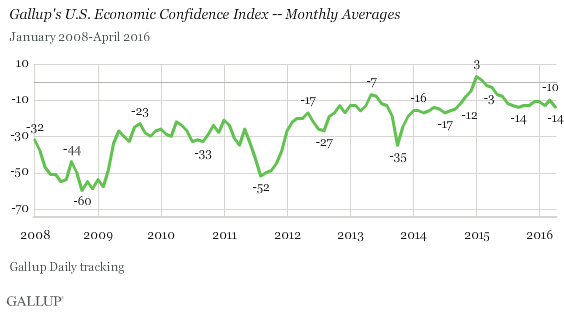
The high point in confidence in Gallup's eight-year tracking trend occurred in January 2015, when the monthly index averaged +3, while the low point was -60 in October 2008. Gallup's U.S. Economic Confidence Index has a theoretical range of -100 to +100, with positive scores indicating Americans are more positive than negative about the economy. Scores have been primarily negative since 2008, although confidence has been much less negative in recent years than it was during the Great Recession.
Although the U.S. labor market remains strong and U.S. stock values are high, there are still questions about how strong the economy is. The government's recently released gross domestic product estimates indicate the economy barely grew in the first quarter of 2016, with retail spending especially weak. First quarter growth was also weak in 2014 and 2015, but those disappointing figures came amid particularly bad winter weather in many parts of the country; however, this year's winter brought milder temperatures.
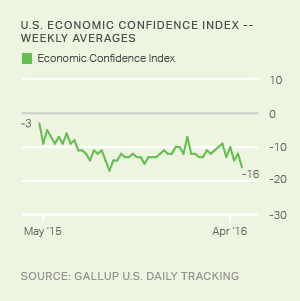
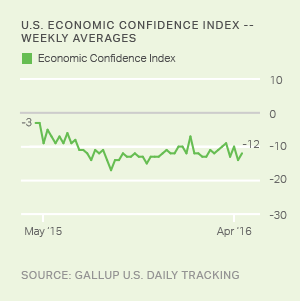
Economic confidence varied significantly throughout April, with Gallup's three-day rolling averages falling as low as -20 on two separate occasions and as high as -8. The most recent weekly average, based on April 25-May 1 interviewing, shows the confidence index at -15, right around the monthly average.
Americans Less Negative About Current State of the Economy Than Its Outlook
Gallup's U.S. Economic Confidence Index is based on Americans' ratings of current conditions and their outlook on whether the economy is getting better or worse. Since March 2015, Americans have been more upbeat about the current state of the economy than about the direction in which it is headed. In late 2014 and early 2015, as gas prices dropped, the two ratings were generally similar.
In April, 24% of Americans rated current economic conditions as "excellent" or "good," while 30% said they were "poor," resulting in a current conditions score of -6. At the same time, 37% said the economy was "getting better" and 58% said it was "getting worse," for an economic outlook score of -21. The gap between the two ratings ties as the largest in the past year.
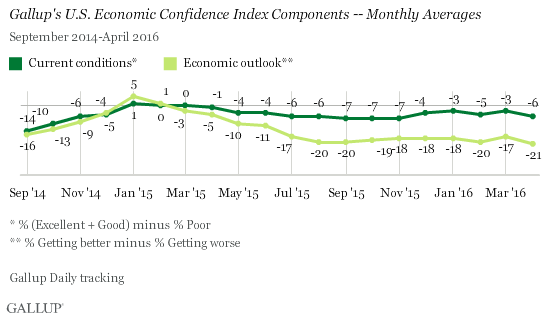
Gallup has not found a lower economic outlook score than the current one since November 2013, when 34% of Americans thought the economy was getting better and 61% thought it was getting worse.
All Party Groups More Negative About the Economy
Americans' confidence in the economy is influenced to a significant degree by political considerations, namely the match between an individual's party identification and the party of the U.S. president. As such, Democrats have consistently had greater confidence than independents and especially Republicans during Barack Obama's presidency.
Despite these consistent differences, confidence has mostly risen and fallen by similar amounts among each party group over the past few years, including in April. All three party groups showed slight drops of between two and four index points in April compared with March. The April U.S. Economic Confidence Index score was +10 among Democrats, -15 among independents and -38 among Republicans.
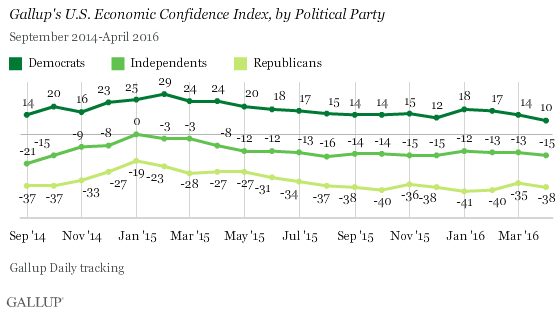
Democrats' index score has mostly been in positive territory since February 2012, roughly when Obama's re-election campaign kicked off. The only exception occurred in October 2013; during the partial federal government shutdown, confidence plunged and Democrats' monthly index score dropped to -9.
Implications
Although U.S. employment numbers are strong and stock values are high, there are other indications -- most notably GDP and retail spending -- that raise doubts about whether the economy is currently healthy. This is reflected in Americans' slightly more negative assessment of the U.S. economy and presidential candidates' acknowledgement that certain aspects of the economy need to be addressed. It is also made clear by the Federal Reserve's caution to date in raising interest rates.
In 2014 and 2015, weak first quarter economic growth was followed by stronger growth and increased consumer spending in the second quarter, with many economists attributing the slower first quarters to poor weather. But the sluggish first quarter this year is not a result of poor winter weather holding down consumer activity; thus, it is less predictable whether GDP will bounce back in the second quarter.
One positive sign is that Gallup's measure of consumer spending -- based on respondent self-reports of their actual spending -- showed a strong increase in April, suggesting that second quarter consumer activity could be off to a relatively strong start.
These data are available in Gallup Analytics.
Survey Methods
Results for this Gallup poll are based on telephone interviews conducted April 1-30, 2016, on the Gallup U.S. Daily survey, with a random sample of 15,198 adults, aged 18 and older, living in all 50 U.S. states and the District of Columbia. For results based on the total sample of national adults, the margin of sampling error is ±1 percentage points at the 95% confidence level. All reported margins of sampling error include computed design effects for weighting.
Each sample of national adults includes a minimum quota of 60% cellphone respondents and 40% landline respondents, with additional minimum quotas by time zone within region. Landline and cellular telephone numbers are selected using random-digit-dial methods.
Learn more about how Gallup Daily tracking works.
