Story Highlights
- Hawaii and Colorado are the only two states with obesity rate below 20%
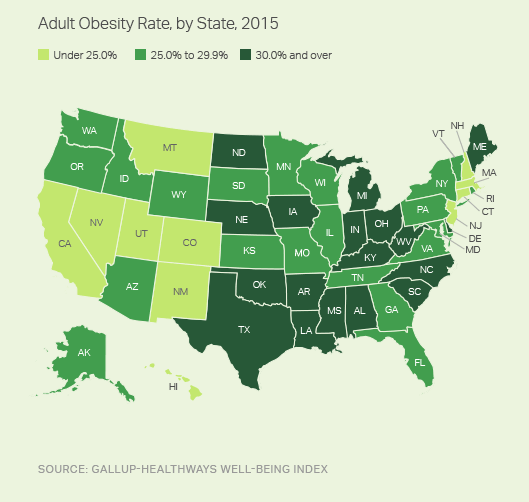
- Obesity rate exceeds 30.0% in 18 states
- Fourteen states have seen significant increases in obesity since 2008
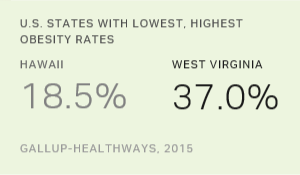
WASHINGTON, D.C. -- At 18.5%, Hawaii has the lowest adult obesity rate in the U.S., closely followed by Colorado at 19.8%. They are the only two states in which the obesity rate is below 20%. West Virginia has the highest adult obesity rate, at 37.0%. In addition to West Virginia, at least one in three adults are obese in Mississippi, Delaware, Arkansas and Oklahoma.
| Obese% | |||||||||||||||||||||||||||||||||||||||||||||||||||||||||||||||||||||||||||||||||||||||||||||||||||
|---|---|---|---|---|---|---|---|---|---|---|---|---|---|---|---|---|---|---|---|---|---|---|---|---|---|---|---|---|---|---|---|---|---|---|---|---|---|---|---|---|---|---|---|---|---|---|---|---|---|---|---|---|---|---|---|---|---|---|---|---|---|---|---|---|---|---|---|---|---|---|---|---|---|---|---|---|---|---|---|---|---|---|---|---|---|---|---|---|---|---|---|---|---|---|---|---|---|---|---|
| States with lowest obesity percentage | |||||||||||||||||||||||||||||||||||||||||||||||||||||||||||||||||||||||||||||||||||||||||||||||||||
| Hawaii | 18.5 | ||||||||||||||||||||||||||||||||||||||||||||||||||||||||||||||||||||||||||||||||||||||||||||||||||
| Colorado | 19.8 | ||||||||||||||||||||||||||||||||||||||||||||||||||||||||||||||||||||||||||||||||||||||||||||||||||
| Massachusetts | 23.6 | ||||||||||||||||||||||||||||||||||||||||||||||||||||||||||||||||||||||||||||||||||||||||||||||||||
| New Mexico | 23.7 | ||||||||||||||||||||||||||||||||||||||||||||||||||||||||||||||||||||||||||||||||||||||||||||||||||
| Nevada | 23.9 | ||||||||||||||||||||||||||||||||||||||||||||||||||||||||||||||||||||||||||||||||||||||||||||||||||
| California | 23.9 | ||||||||||||||||||||||||||||||||||||||||||||||||||||||||||||||||||||||||||||||||||||||||||||||||||
| Montana | 24.1 | ||||||||||||||||||||||||||||||||||||||||||||||||||||||||||||||||||||||||||||||||||||||||||||||||||
| New Hampshire | 24.3 | ||||||||||||||||||||||||||||||||||||||||||||||||||||||||||||||||||||||||||||||||||||||||||||||||||
| Utah | 24.5 | ||||||||||||||||||||||||||||||||||||||||||||||||||||||||||||||||||||||||||||||||||||||||||||||||||
| New Jersey | 24.7 | ||||||||||||||||||||||||||||||||||||||||||||||||||||||||||||||||||||||||||||||||||||||||||||||||||
| States with highest obesity percentage | |||||||||||||||||||||||||||||||||||||||||||||||||||||||||||||||||||||||||||||||||||||||||||||||||||
| West Virginia | 37.0 | ||||||||||||||||||||||||||||||||||||||||||||||||||||||||||||||||||||||||||||||||||||||||||||||||||
| Mississippi | 35.5 | ||||||||||||||||||||||||||||||||||||||||||||||||||||||||||||||||||||||||||||||||||||||||||||||||||
| Delaware | 33.8 | ||||||||||||||||||||||||||||||||||||||||||||||||||||||||||||||||||||||||||||||||||||||||||||||||||
| Arkansas | 33.5 | ||||||||||||||||||||||||||||||||||||||||||||||||||||||||||||||||||||||||||||||||||||||||||||||||||
| Oklahoma | 33.5 | ||||||||||||||||||||||||||||||||||||||||||||||||||||||||||||||||||||||||||||||||||||||||||||||||||
| Ohio | 31.6 | ||||||||||||||||||||||||||||||||||||||||||||||||||||||||||||||||||||||||||||||||||||||||||||||||||
| Maine | 31.5 | ||||||||||||||||||||||||||||||||||||||||||||||||||||||||||||||||||||||||||||||||||||||||||||||||||
| Michigan | 31.5 | ||||||||||||||||||||||||||||||||||||||||||||||||||||||||||||||||||||||||||||||||||||||||||||||||||
| Kentucky | 31.4 | ||||||||||||||||||||||||||||||||||||||||||||||||||||||||||||||||||||||||||||||||||||||||||||||||||
| South Carolina | 31.4 | ||||||||||||||||||||||||||||||||||||||||||||||||||||||||||||||||||||||||||||||||||||||||||||||||||
| Gallup-Healthways Well-Being Index, 2015 | |||||||||||||||||||||||||||||||||||||||||||||||||||||||||||||||||||||||||||||||||||||||||||||||||||
These data, from daily interviews conducted January through December 2015 as part of the Gallup-Healthways Well-Being Index, are based on U.S. adults' self-reports of their height and weight, which are then used to calculate Body Mass Index (BMI) scores. Americans who have a BMI of 30 or higher are classified as obese.
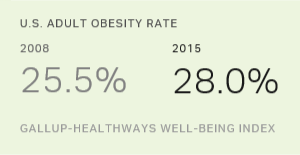
The national obesity rate reached a new high of 28.0% in 2015, up significantly from 25.5% in 2008, when Gallup and Healthways began tracking obesity. Fourteen states had statistically significant increases in their obesity rates from 2008 to 2015, while no state registered a statistically significant decline. Maine, West Virginia, Idaho and Oklahoma experienced the sharpest upticks in obesity.
| 2008% | 2015% | Increasepct. pts. | |||||||||||||||||||||||||||||||||||||||||||||||||||||||||||||||||||||||||||||||||||||||||||||||||
|---|---|---|---|---|---|---|---|---|---|---|---|---|---|---|---|---|---|---|---|---|---|---|---|---|---|---|---|---|---|---|---|---|---|---|---|---|---|---|---|---|---|---|---|---|---|---|---|---|---|---|---|---|---|---|---|---|---|---|---|---|---|---|---|---|---|---|---|---|---|---|---|---|---|---|---|---|---|---|---|---|---|---|---|---|---|---|---|---|---|---|---|---|---|---|---|---|---|---|---|
| Maine | 24.9 | 31.5 | 6.6 | ||||||||||||||||||||||||||||||||||||||||||||||||||||||||||||||||||||||||||||||||||||||||||||||||
| West Virginia | 30.5 | 37.0 | 6.5 | ||||||||||||||||||||||||||||||||||||||||||||||||||||||||||||||||||||||||||||||||||||||||||||||||
| Idaho | 24.0 | 29.7 | 5.7 | ||||||||||||||||||||||||||||||||||||||||||||||||||||||||||||||||||||||||||||||||||||||||||||||||
| Oklahoma | 28.0 | 33.5 | 5.5 | ||||||||||||||||||||||||||||||||||||||||||||||||||||||||||||||||||||||||||||||||||||||||||||||||
| Iowa | 26.4 | 31.3 | 4.9 | ||||||||||||||||||||||||||||||||||||||||||||||||||||||||||||||||||||||||||||||||||||||||||||||||
| Michigan | 26.7 | 31.5 | 4.8 | ||||||||||||||||||||||||||||||||||||||||||||||||||||||||||||||||||||||||||||||||||||||||||||||||
| Ohio | 27.6 | 31.6 | 4.0 | ||||||||||||||||||||||||||||||||||||||||||||||||||||||||||||||||||||||||||||||||||||||||||||||||
| South Carolina | 27.6 | 31.4 | 3.8 | ||||||||||||||||||||||||||||||||||||||||||||||||||||||||||||||||||||||||||||||||||||||||||||||||
| North Carolina | 26.7 | 30.4 | 3.7 | ||||||||||||||||||||||||||||||||||||||||||||||||||||||||||||||||||||||||||||||||||||||||||||||||
| Texas | 27.1 | 30.7 | 3.6 | ||||||||||||||||||||||||||||||||||||||||||||||||||||||||||||||||||||||||||||||||||||||||||||||||
| Georgia | 26.0 | 28.8 | 2.8 | ||||||||||||||||||||||||||||||||||||||||||||||||||||||||||||||||||||||||||||||||||||||||||||||||
| Washington | 24.5 | 27.1 | 2.6 | ||||||||||||||||||||||||||||||||||||||||||||||||||||||||||||||||||||||||||||||||||||||||||||||||
| Florida | 24.2 | 26.5 | 2.3 | ||||||||||||||||||||||||||||||||||||||||||||||||||||||||||||||||||||||||||||||||||||||||||||||||
| Pennsylvania | 27.2 | 29.2 | 2.0 | ||||||||||||||||||||||||||||||||||||||||||||||||||||||||||||||||||||||||||||||||||||||||||||||||
| Gallup-Healthways Well-Being Index | |||||||||||||||||||||||||||||||||||||||||||||||||||||||||||||||||||||||||||||||||||||||||||||||||||
Obesity Remains Highest in the South, Lowest in the West
Of the 18 states with obesity rates of at least 30.0%, all but one are located in the South or Midwest. Meanwhile, all 11 states with obesity rates below 25.0% are located in the Northeast or West.
Since 2008, the obesity rate for the Midwest has increased by 3.2 percentage points, more than any other region. The South followed closely behind, with a 2.9-point increase. The Northeast and West have seen smaller, but still statistically significant, increases of 2.0 and 1.8 points, respectively.
| 2008% | 2015% | Increasepct. pts. | |||||||||||||||||||||||||||||||||||||||||||||||||||||||||||||||||||||||||||||||||||||||||||||||||
|---|---|---|---|---|---|---|---|---|---|---|---|---|---|---|---|---|---|---|---|---|---|---|---|---|---|---|---|---|---|---|---|---|---|---|---|---|---|---|---|---|---|---|---|---|---|---|---|---|---|---|---|---|---|---|---|---|---|---|---|---|---|---|---|---|---|---|---|---|---|---|---|---|---|---|---|---|---|---|---|---|---|---|---|---|---|---|---|---|---|---|---|---|---|---|---|---|---|---|---|
| Midwest | 26.8 | 30.0 | +3.2 | ||||||||||||||||||||||||||||||||||||||||||||||||||||||||||||||||||||||||||||||||||||||||||||||||
| South | 27.0 | 29.9 | +2.9 | ||||||||||||||||||||||||||||||||||||||||||||||||||||||||||||||||||||||||||||||||||||||||||||||||
| Northeast | 24.2 | 26.2 | +2.0 | ||||||||||||||||||||||||||||||||||||||||||||||||||||||||||||||||||||||||||||||||||||||||||||||||
| West | 22.8 | 24.6 | +1.8 | ||||||||||||||||||||||||||||||||||||||||||||||||||||||||||||||||||||||||||||||||||||||||||||||||
| Gallup-Healthways Well-Being Index | |||||||||||||||||||||||||||||||||||||||||||||||||||||||||||||||||||||||||||||||||||||||||||||||||||
As Obesity Rates Rise, So Do Healthcare Costs
Given that obesity is associated with illnesses such as heart disease, diabetes, stroke, osteoarthritis and some forms of cancer, the medical costs for an obese person amounted to $1,429 more per year than for a person of a normal weight, according to research conducted in 2008 by RTI International and the Centers for Disease Control and Prevention. After adjusting for inflation, the annual medical costs for 2015 are $1,573 more for a person who is obese than for a person of a normal weight.
Gallup calculated the incremental cost of healthcare per year for each state by multiplying the estimated number of obese people in the state's population by the annual incremental $1,573 cost of obesity per person.
In the five most obese states, the annual incremental cost of obesity per 100,000 residents averages $54 million. By contrast, the average cost is $34 million in the five least obese states. In other words, per capita medical costs attributable to obesity are about 1.6 times higher in the five states with the highest obesity rates than in the states with the five lowest rates. Additional annual medical costs attributable to obesity for each state appear at the end of the article.
| Population (estimate) | Obese% | Annual healthcare cost per 100k adults | Annual healthcare costall adults | ||||||||||||||||||||||||||||||||||||||||||||||||||||||||||||||||||||||||||||||||||||||||||||||||
|---|---|---|---|---|---|---|---|---|---|---|---|---|---|---|---|---|---|---|---|---|---|---|---|---|---|---|---|---|---|---|---|---|---|---|---|---|---|---|---|---|---|---|---|---|---|---|---|---|---|---|---|---|---|---|---|---|---|---|---|---|---|---|---|---|---|---|---|---|---|---|---|---|---|---|---|---|---|---|---|---|---|---|---|---|---|---|---|---|---|---|---|---|---|---|---|---|---|---|---|
| States with highest percentage of obese adults | |||||||||||||||||||||||||||||||||||||||||||||||||||||||||||||||||||||||||||||||||||||||||||||||||||
| West Virginia | 1,452,598 | 37.0 | $58,273,467 | $846,479,005 | |||||||||||||||||||||||||||||||||||||||||||||||||||||||||||||||||||||||||||||||||||||||||||||||
| Mississippi | 2,163,049 | 35.5 | $55,914,797 | $1,209,464,207 | |||||||||||||||||||||||||||||||||||||||||||||||||||||||||||||||||||||||||||||||||||||||||||||||
| Delaware | 697,965 | 33.8 | $53,223,481 | $371,481,197 | |||||||||||||||||||||||||||||||||||||||||||||||||||||||||||||||||||||||||||||||||||||||||||||||
| Arkansas | 2,215,461 | 33.5 | $52,743,928 | $1,168,521,191 | |||||||||||||||||||||||||||||||||||||||||||||||||||||||||||||||||||||||||||||||||||||||||||||||
| Oklahoma | 2,767,117 | 33.5 | $52,647,884 | $1,456,828,340 | |||||||||||||||||||||||||||||||||||||||||||||||||||||||||||||||||||||||||||||||||||||||||||||||
| States with lowest percentage of obese adults | |||||||||||||||||||||||||||||||||||||||||||||||||||||||||||||||||||||||||||||||||||||||||||||||||||
| Hawaii | 1,049,465 | 18.5 | $29,067,060 | $305,048,588 | |||||||||||||||||||||||||||||||||||||||||||||||||||||||||||||||||||||||||||||||||||||||||||||||
| Colorado | 4,019,462 | 19.8 | $31,109,252 | $1,250,424,550 | |||||||||||||||||||||||||||||||||||||||||||||||||||||||||||||||||||||||||||||||||||||||||||||||
| Massachusetts | 5,144,065 | 23.6 | $37,087,771 | $1,907,818,922 | |||||||||||||||||||||||||||||||||||||||||||||||||||||||||||||||||||||||||||||||||||||||||||||||
| New Mexico | 1,596,641 | 23.7 | $37,245,304 | $594,673,741 | |||||||||||||||||||||||||||||||||||||||||||||||||||||||||||||||||||||||||||||||||||||||||||||||
| Nevada | 2,095,527 | 23.9 | $37,539,385 | $786,648,014 | |||||||||||||||||||||||||||||||||||||||||||||||||||||||||||||||||||||||||||||||||||||||||||||||
| Gallup-Healthways Well-Being Index, 2015 | |||||||||||||||||||||||||||||||||||||||||||||||||||||||||||||||||||||||||||||||||||||||||||||||||||
Implications
As the adult obesity rate continues to rise both nationally and within many states, preventable healthcare costs will also rise. If states can lower their obesity rates, even modestly, they can achieve significant cost savings and improve their residents' well-being.
"There's no better time than now to comprehensively look at what drives people to make sustained changes in their lives, as the costs of obesity are staggering, both financially and personally," says Sean Slovenski, president, Population Health Services at Healthways. "We know from both science and experience that to be effective, the weight-loss journey needs to be personalized, easy to implement and supported."
But reducing obesity rates is no easy task. Gallup previously found that Americans are twice as likely to want to lose weight as to say they are seriously trying to do so. Most of the burden for reducing obesity falls on individuals and how motivated they are to consistently make healthier choices. This motivation is often difficult to find and maintain, but there are proven population health interventions that are effective in supporting sustained weight loss.
"We can reverse our nation's growing obesity epidemic," says Dan Buettner, National Geographic Fellow and founder of Blue Zones Project, a community well-being improvement initiative of Healthways and its community partners. "The key is creating an environment that makes the healthy choice not only easy but at times unavoidable -- so that people will eat less, eat better, move more and connect socially. Communities that have the courage to implement simple, evidence-based designs and policies that support lasting change, such as Los Angeles Beach cities, are seeing a measurable reduction in obesity and healthcare costs, and an increase in well-being."
In the long run, interventions designed to prevent and reduce obesity at both the individual and community levels can potentially lead to substantial cost savings for families, employers and states.
Survey Methods
Results are based on telephone interviews conducted Jan. 2-Dec. 30, 2015, as a part of the Gallup-Healthways Well-Being Index, with a random sample of 177,281 adults, aged 18 and older, living in all 50 U.S. states and the District of Columbia. For results based on the total sample of national adults, the margin of sampling error for the Well-Being Index score is ±0.1 point at the 95% confidence level. The margin of sampling error for most states is about ±0.6 points, although this increases to about ±1.6 points for the smallest population states such as North Dakota, Wyoming, Hawaii and Delaware. All reported margins of sampling error include computed design effects for weighting.
Each sample of national adults includes a minimum quota of 60% cellphone respondents and 40% landline respondents, with additional minimum quotas by time zone within region. Landline and cellular telephone numbers are selected using random-digit-dial methods.
Learn more about how the Gallup-Healthways Well-Being Index works.
| Population(estimate) | Obese% | Annual healthcare cost, $per 100k adults | Annual healthcare cost, $all adults | ||||||||||||||||||||||||||||||||||||||||||||||||||||||||||||||||||||||||||||||||||||||||||||||||
|---|---|---|---|---|---|---|---|---|---|---|---|---|---|---|---|---|---|---|---|---|---|---|---|---|---|---|---|---|---|---|---|---|---|---|---|---|---|---|---|---|---|---|---|---|---|---|---|---|---|---|---|---|---|---|---|---|---|---|---|---|---|---|---|---|---|---|---|---|---|---|---|---|---|---|---|---|---|---|---|---|---|---|---|---|---|---|---|---|---|---|---|---|---|---|---|---|---|---|---|
| Alabama | 3,605,323 | 31.3 | 49,226,788 | 1,774,784,825 | |||||||||||||||||||||||||||||||||||||||||||||||||||||||||||||||||||||||||||||||||||||||||||||||
| Alaska | 507,786 | 26.9 | 42,341,525 | 215,004,526 | |||||||||||||||||||||||||||||||||||||||||||||||||||||||||||||||||||||||||||||||||||||||||||||||
| Arizona | 4,997,570 | 25.2 | 39,607,728 | 1,979,424,088 | |||||||||||||||||||||||||||||||||||||||||||||||||||||||||||||||||||||||||||||||||||||||||||||||
| Arkansas | 2,215,461 | 33.5 | 52,743,928 | 1,168,521,191 | |||||||||||||||||||||||||||||||||||||||||||||||||||||||||||||||||||||||||||||||||||||||||||||||
| California | 28,976,914 | 23.9 | 37,568,175 | 10,886,097,470 | |||||||||||||||||||||||||||||||||||||||||||||||||||||||||||||||||||||||||||||||||||||||||||||||
| Colorado | 4,019,462 | 19.8 | 31,109,252 | 1,250,424,550 | |||||||||||||||||||||||||||||||||||||||||||||||||||||||||||||||||||||||||||||||||||||||||||||||
| Connecticut | 2,753,871 | 24.9 | 39,121,828 | 1,077,364,755 | |||||||||||||||||||||||||||||||||||||||||||||||||||||||||||||||||||||||||||||||||||||||||||||||
| Delaware | 697,965 | 33.8 | 53,223,481 | 371,481,197 | |||||||||||||||||||||||||||||||||||||||||||||||||||||||||||||||||||||||||||||||||||||||||||||||
| Florida | 15,310,183 | 26.5 | 41,640,933 | 6,375,302,924 | |||||||||||||||||||||||||||||||||||||||||||||||||||||||||||||||||||||||||||||||||||||||||||||||
| Georgia | 7,308,940 | 28.8 | 45,270,849 | 3,308,819,237 | |||||||||||||||||||||||||||||||||||||||||||||||||||||||||||||||||||||||||||||||||||||||||||||||
| Hawaii | 1,049,465 | 18.5 | 29,067,060 | 305,048,588 | |||||||||||||||||||||||||||||||||||||||||||||||||||||||||||||||||||||||||||||||||||||||||||||||
| Idaho | 1,143,436 | 29.7 | 46,672,559 | 533,670,743 | |||||||||||||||||||||||||||||||||||||||||||||||||||||||||||||||||||||||||||||||||||||||||||||||
| Illinois | 9,722,823 | 28.5 | 44,791,368 | 4,354,985,445 | |||||||||||||||||||||||||||||||||||||||||||||||||||||||||||||||||||||||||||||||||||||||||||||||
| Indiana | 4,787,573 | 30.8 | 48,507,743 | 2,322,343,645 | |||||||||||||||||||||||||||||||||||||||||||||||||||||||||||||||||||||||||||||||||||||||||||||||
| Iowa | 2,350,298 | 31.3 | 49,183,224 | 1,155,952,222 | |||||||||||||||||||||||||||||||||||||||||||||||||||||||||||||||||||||||||||||||||||||||||||||||
| Kansas | 2,122,250 | 29.4 | 46,246,165 | 981,459,412 | |||||||||||||||||||||||||||||||||||||||||||||||||||||||||||||||||||||||||||||||||||||||||||||||
| Kentucky | 3,388,106 | 31.4 | 49,371,304 | 1,672,751,984 | |||||||||||||||||||||||||||||||||||||||||||||||||||||||||||||||||||||||||||||||||||||||||||||||
| Louisiana | 3,401,841 | 30.9 | 48,678,881 | 1,655,978,248 | |||||||||||||||||||||||||||||||||||||||||||||||||||||||||||||||||||||||||||||||||||||||||||||||
| Maine | 1,059,901 | 31.5 | 49,616,061 | 525,881,043 | |||||||||||||||||||||||||||||||||||||||||||||||||||||||||||||||||||||||||||||||||||||||||||||||
| Maryland | 4,579,313 | 28.8 | 45,234,297 | 2,071,420,005 | |||||||||||||||||||||||||||||||||||||||||||||||||||||||||||||||||||||||||||||||||||||||||||||||
| Massachusetts | 5,144,065 | 23.6 | 37,087,771 | 1,907,818,922 | |||||||||||||||||||||||||||||||||||||||||||||||||||||||||||||||||||||||||||||||||||||||||||||||
| Michigan | 7,626,867 | 31.5 | 49,506,287 | 3,775,778,488 | |||||||||||||||||||||||||||||||||||||||||||||||||||||||||||||||||||||||||||||||||||||||||||||||
| Minnesota | 4,108,141 | 25.5 | 40,135,581 | 1,648,826,157 | |||||||||||||||||||||||||||||||||||||||||||||||||||||||||||||||||||||||||||||||||||||||||||||||
| Mississippi | 2,163,049 | 35.5 | 55,914,797 | 1,209,464,207 | |||||||||||||||||||||||||||||||||||||||||||||||||||||||||||||||||||||||||||||||||||||||||||||||
| Missouri | 4,599,839 | 29.9 | 47,037,567 | 2,163,652,388 | |||||||||||||||||||||||||||||||||||||||||||||||||||||||||||||||||||||||||||||||||||||||||||||||
| Montana | 761,679 | 24.1 | 37,963,384 | 289,159,074 | |||||||||||||||||||||||||||||||||||||||||||||||||||||||||||||||||||||||||||||||||||||||||||||||
| Nebraska | 1,382,728 | 30.8 | 48,440,906 | 669,805,974 | |||||||||||||||||||||||||||||||||||||||||||||||||||||||||||||||||||||||||||||||||||||||||||||||
| Nevada | 2,095,527 | 23.9 | 37,539,385 | 786,648,014 | |||||||||||||||||||||||||||||||||||||||||||||||||||||||||||||||||||||||||||||||||||||||||||||||
| New Hampshire | 1,047,071 | 24.3 | 38,252,914 | 400,535,242 | |||||||||||||||||||||||||||||||||||||||||||||||||||||||||||||||||||||||||||||||||||||||||||||||
| New Jersey | 6,783,035 | 24.7 | 38,811,280 | 2,632,582,873 | |||||||||||||||||||||||||||||||||||||||||||||||||||||||||||||||||||||||||||||||||||||||||||||||
| New Mexico | 1,596,641 | 23.7 | 37,245,304 | 594,673,741 | |||||||||||||||||||||||||||||||||||||||||||||||||||||||||||||||||||||||||||||||||||||||||||||||
| New York | 15,288,727 | 25.2 | 39,662,822 | 6,063,940,591 | |||||||||||||||||||||||||||||||||||||||||||||||||||||||||||||||||||||||||||||||||||||||||||||||
| North Carolina | 7,348,433 | 30.4 | 47,864,652 | 3,517,301,775 | |||||||||||||||||||||||||||||||||||||||||||||||||||||||||||||||||||||||||||||||||||||||||||||||
| North Dakota | 546,602 | 31.3 | 49,265,603 | 269,286,532 | |||||||||||||||||||||||||||||||||||||||||||||||||||||||||||||||||||||||||||||||||||||||||||||||
| Ohio | 8,845,679 | 31.6 | 49,668,724 | 4,393,535,766 | |||||||||||||||||||||||||||||||||||||||||||||||||||||||||||||||||||||||||||||||||||||||||||||||
| Oklahoma | 2,767,117 | 33.5 | 52,647,884 | 1,456,828,340 | |||||||||||||||||||||||||||||||||||||||||||||||||||||||||||||||||||||||||||||||||||||||||||||||
| Oregon | 3,092,890 | 27.1 | 42,567,733 | 1,316,573,044 | |||||||||||||||||||||||||||||||||||||||||||||||||||||||||||||||||||||||||||||||||||||||||||||||
| Pennsylvania | 10,088,111 | 29.2 | 45,922,440 | 4,632,706,653 | |||||||||||||||||||||||||||||||||||||||||||||||||||||||||||||||||||||||||||||||||||||||||||||||
| Rhode Island | 833,367 | 27.9 | 43,832,271 | 365,283,748 | |||||||||||||||||||||||||||||||||||||||||||||||||||||||||||||||||||||||||||||||||||||||||||||||
| South Carolina | 3,601,643 | 31.4 | 49,324,541 | 1,776,493,862 | |||||||||||||||||||||||||||||||||||||||||||||||||||||||||||||||||||||||||||||||||||||||||||||||
| South Dakota | 629,820 | 25.1 | 39,527,315 | 248,950,936 | |||||||||||||||||||||||||||||||||||||||||||||||||||||||||||||||||||||||||||||||||||||||||||||||
| Tennessee | 4,951,234 | 29.5 | 46,352,321 | 2,295,012,093 | |||||||||||||||||||||||||||||||||||||||||||||||||||||||||||||||||||||||||||||||||||||||||||||||
| Texas | 19,317,031 | 30.7 | 48,335,957 | 9,337,071,646 | |||||||||||||||||||||||||||||||||||||||||||||||||||||||||||||||||||||||||||||||||||||||||||||||
| Utah | 1,987,310 | 24.5 | 38,590,349 | 766,909,780 | |||||||||||||||||||||||||||||||||||||||||||||||||||||||||||||||||||||||||||||||||||||||||||||||
| Vermont | 496,733 | 27.5 | 43,201,649 | 214,596,826 | |||||||||||||||||||||||||||||||||||||||||||||||||||||||||||||||||||||||||||||||||||||||||||||||
| Virginia | 6,283,576 | 26.3 | 41,358,191 | 2,598,773,404 | |||||||||||||||||||||||||||||||||||||||||||||||||||||||||||||||||||||||||||||||||||||||||||||||
| Washington | 5,240,763 | 27.1 | 42,659,689 | 2,235,693,068 | |||||||||||||||||||||||||||||||||||||||||||||||||||||||||||||||||||||||||||||||||||||||||||||||
| West Virginia | 1,452,598 | 37.0 | 58,273,467 | 846,479,005 | |||||||||||||||||||||||||||||||||||||||||||||||||||||||||||||||||||||||||||||||||||||||||||||||
| Wisconsin | 4,288,406 | 27.4 | 43,094,391 | 1,848,062,566 | |||||||||||||||||||||||||||||||||||||||||||||||||||||||||||||||||||||||||||||||||||||||||||||||
| Wyoming | 440,048 | 25.8 | 40,556,297 | 178,467,077 | |||||||||||||||||||||||||||||||||||||||||||||||||||||||||||||||||||||||||||||||||||||||||||||||
| Gallup-Healthways Well-Being Index, 2015 | |||||||||||||||||||||||||||||||||||||||||||||||||||||||||||||||||||||||||||||||||||||||||||||||||||