Story Highlights
- 42% have a "great deal" or "fair amount" of trust in political leaders
- 56% trust American people to make decisions under democratic system
- Trust in both groups down about 20 percentage points since 2004
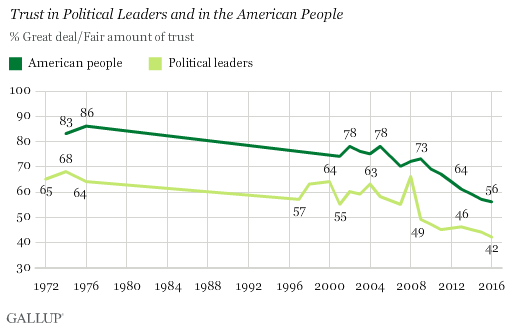
PRINCETON, N.J. -- Americans' trust in their political leaders and in the American people themselves to make political decisions continues to decline. The percentages trusting the American people (56%) and political leaders (42%) are down roughly 20 percentage points since 2004 and are currently at new lows in Gallup's trends.

More specifically, the survey asks U.S. adults how much they trust "the men and women in political life in this country who either hold or are running for political office" and how much trust they have in the American people to make "judgments under our democratic system about the issues facing our country."
These items are included in Gallup's annual Governance poll, conducted each September, alongside questions measuring Americans' trust in the three branches of the federal government, state and local governments, and the mass media.
Trust in most of these institutions is lower now than a decade ago. This is possibly a symptom of Americans' low levels of satisfaction with the way things are going in the country. In the past decade, Americans' top concerns have been the economy, the Iraq War and the way the government is working in general.
However, while levels of trust in political leaders, the American people and the mass media all continue to erode this year, trust in the three branches of the federal government and in state and local governments has improved.
Current Gap in Trust Between People, Leaders Is Typical
Not surprisingly, more Americans have always said they trust the American people than have said they trust political leaders. The current 14-point gap in trust between these groups matches the average in Gallup's trend, first measured during the Watergate era and updated more regularly since the early 2000s.
The high point in trust in the American people was 86% in 1976. The high point in trust in political leaders, ironically, was 68% in April 1974, just months before President Richard Nixon resigned the presidency because of the Watergate scandal. At that time, Americans' loss of faith appeared to be limited to Nixon and the executive branch of government (40% trust) and not to Congress (68% trust) or other political institutions.
Americans' trust in political leaders also spiked to 66% in September 2008, in the midst of the presidential election campaign between Barack Obama and John McCain. That increase represented the only major interruption in the steady decline in trust in political leaders over the past decade-plus.
Democrats Have More Trust in Political Leaders
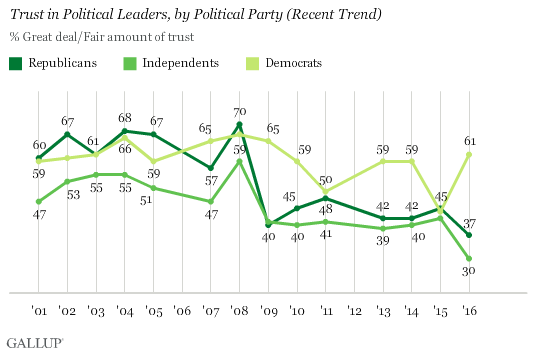
Democrats (61%) are more likely than Republicans (37%) to say they trust political leaders, with independents being the least trusting (30%) among the major political groups. Democrats' and Republicans' trust levels were generally similar until 2009, when Republicans' trust fell, likely in response to Democratic President Obama taking office. Since then, Democrats have typically expressed more trust than Republicans, apart from a few isolated years, including 2015.

Trust in political leaders has declined at least somewhat among all party groups since the mid-2000s, with more change seen among independents and Republicans than among Democrats.
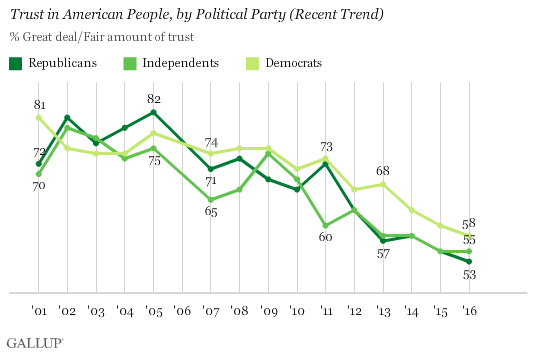
Historically, there have been only modest party differences in trust in the American people, something that is less plainly connected to the current party power structure in Washington than is trust in political leaders. Currently, 58% of Democrats, 55% of independents and 53% of Republicans say they have a "great deal" or "fair amount" of trust in the American people to make judgments about the issues facing the country. All party groups have significantly less trust in the American people today than in the mid-2000s.

Implications
At no point in the last four decades have Americans expressed less trust than they do today in U.S. political leaders or in the American people who voted those leaders into office. Both trends were already in place long before this year's presidential campaign saw primary voters choose, and their political parties nominate, the worst-rated presidential candidates in recent memory.
Americans' dour view of the state of the nation appears to be affecting the way they view many U.S. institutions, both political and nonpolitical. Americans' trust in political leaders and in the American people as a whole began declining during George W. Bush's second term, the same time their confidence in nonpolitical institutions started heading downward. These trends have yet to recover even after the U.S. ended major military operations in Iraq and after the economy emerged, albeit sluggishly, from the worst economic recession in several generations.
Voter frustration was arguably a major factor behind Donald Trump's victory in the GOP primaries and Bernie Sanders' unexpectedly strong challenge to Hillary Clinton in the Democratic primaries. Whether Trump or Clinton is elected in November, the winner will be governing at a time when Americans' trust in nearly all major U.S. institutions -- including the American people themselves -- is at or near historical lows.
Historical data are available in Gallup Analytics.
Survey Methods
Results for this Gallup poll are based on telephone interviews conducted Sept. 7-11, 2016, with a random sample of 1,020 adults, aged 18 and older, living in all 50 U.S. states and the District of Columbia. For results based on the total sample of national adults, the margin of sampling error is ±4 percentage points at the 95% confidence level. All reported margins of sampling error include computed design effects for weighting.
Each sample of national adults includes a minimum quota of 60% cellphone respondents and 40% landline respondents, with additional minimum quotas by time zone within region. Landline and cellular telephone numbers are selected using random-digit-dial methods.
View complete question responses and trends.
Learn more about how the Gallup Poll Social Series works.


