Story Highlights
- Confidence in judicial branch highest, at 61%; up eight points
- Democrats fuel six-point increase in executive branch rating
- Confidence in legislative branch still low, but improved
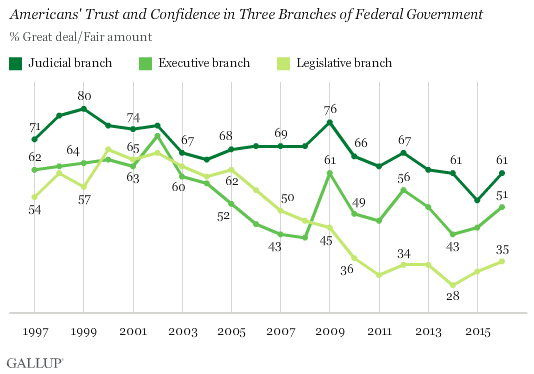
PRINCETON, N.J. -- Americans express as much or slightly more confidence in each of the three branches of the federal government than they did in 2014 and 2015, when their confidence fell to record or near-record lows. Public confidence in the judicial branch has recovered to 61% after slipping to 53% in 2015. Meanwhile, since 2014, confidence in the executive branch has climbed eight percentage points to 51%, and confidence in the legislative branch has improved seven points to 35%.

Confidence in each government branch is now similar to where it stood in 2013, but is still well below the averages in Gallup's annual trend since 1997 (68% for the judicial branch, 55% for the executive branch and 49% for the legislative branch).
The latest results are based on Gallup's 2016 Governance poll, conducted Sept. 7-11, and represent the percentage of Americans saying they have a "great deal" or "fair amount" of confidence in each branch of government.
At the other end of the scale, 24% of Americans currently say they have no confidence in the executive branch. Another 20% have no confidence in the legislative branch, while just 9% have no confidence in the judiciary. The remainder have "not very much" confidence in each branch or express no opinion.
Democrats More Confident Than GOP in the Presidency, Judiciary
The recent increase in public trust in the executive branch largely comes from Democrats' rising confidence, which jumped from 77% in 2015 to 84% this year, consistent with President Barack Obama's improved job approval ratings. By contrast, increased confidence in the legislative branch has occurred about equally among Republicans and Democrats, although confidence remains in the 30% range among both groups.
After plummeting in 2015 to 43% -- likely in reaction to Supreme Court decisions essentially upholding the Affordable Care Act and legalizing gay marriage -- Republicans' confidence in the judicial branch has increased to 51%. However, it remains below pre-2015 levels. Democrats' confidence in the judiciary is now at 71%, up from 64% in 2015.
| 2014 | 2015 | 2016 | ||||||||||||||||||||||||||||||||||||||||||||||||||||||||||||||||||||||||||||||||||||||||||||||||||
|---|---|---|---|---|---|---|---|---|---|---|---|---|---|---|---|---|---|---|---|---|---|---|---|---|---|---|---|---|---|---|---|---|---|---|---|---|---|---|---|---|---|---|---|---|---|---|---|---|---|---|---|---|---|---|---|---|---|---|---|---|---|---|---|---|---|---|---|---|---|---|---|---|---|---|---|---|---|---|---|---|---|---|---|---|---|---|---|---|---|---|---|---|---|---|---|---|---|---|---|---|
| % | % | % | ||||||||||||||||||||||||||||||||||||||||||||||||||||||||||||||||||||||||||||||||||||||||||||||||||
| Executive branch | ||||||||||||||||||||||||||||||||||||||||||||||||||||||||||||||||||||||||||||||||||||||||||||||||||||
| Republicans/Lean Republican | 16 | 16 | 18 | |||||||||||||||||||||||||||||||||||||||||||||||||||||||||||||||||||||||||||||||||||||||||||||||||
| Democrats/Lean Democratic | 77 | 77 | 84 | |||||||||||||||||||||||||||||||||||||||||||||||||||||||||||||||||||||||||||||||||||||||||||||||||
| Legislative branch | ||||||||||||||||||||||||||||||||||||||||||||||||||||||||||||||||||||||||||||||||||||||||||||||||||||
| Republicans/Lean Republican | 28 | 32 | 37 | |||||||||||||||||||||||||||||||||||||||||||||||||||||||||||||||||||||||||||||||||||||||||||||||||
| Democrats/Lean Democratic | 28 | 28 | 34 | |||||||||||||||||||||||||||||||||||||||||||||||||||||||||||||||||||||||||||||||||||||||||||||||||
| Judicial branch | ||||||||||||||||||||||||||||||||||||||||||||||||||||||||||||||||||||||||||||||||||||||||||||||||||||
| Republicans/Lean Republican | 60 | 43 | 51 | |||||||||||||||||||||||||||||||||||||||||||||||||||||||||||||||||||||||||||||||||||||||||||||||||
| Democrats/Lean Democratic | 67 | 64 | 71 | |||||||||||||||||||||||||||||||||||||||||||||||||||||||||||||||||||||||||||||||||||||||||||||||||
| Recent trend | ||||||||||||||||||||||||||||||||||||||||||||||||||||||||||||||||||||||||||||||||||||||||||||||||||||
| Gallup | ||||||||||||||||||||||||||||||||||||||||||||||||||||||||||||||||||||||||||||||||||||||||||||||||||||
Government Seen as More Capable of Handling Problems
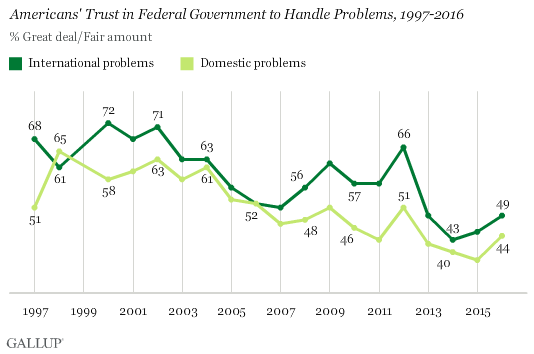
In the same poll, Gallup asked Americans about their confidence in the federal government to handle domestic and, separately, international problems. Here too, declining confidence since 2011 and 2012 appears to have arrested, and confidence has started to trend upward.
Currently, 49% of Americans are confident in the government to handle international problems, up slightly from 45% a year ago and 43% in 2014. Confidence in the government to handle domestic problems is now at 44%, up from 38% in 2015.

As with partisan confidence in the executive branch, increases in public trust in the government to handle domestic and international problems are mainly a function of higher trust among Democrats. This likely reflects their support for Obama in his final year in office after Republican presidential nominee Donald Trump and other Republican candidates for office have attacked his leadership.
Democrats' confidence in the government to handle domestic problems has risen by 11 points over the past year, to 64%, and has increased by 10 points to 72% for international problems. Republicans' confidence in the government to handle each dimension is unchanged.
| 2014 | 2015 | 2016 | ||||||||||||||||||||||||||||||||||||||||||||||||||||||||||||||||||||||||||||||||||||||||||||||||||
|---|---|---|---|---|---|---|---|---|---|---|---|---|---|---|---|---|---|---|---|---|---|---|---|---|---|---|---|---|---|---|---|---|---|---|---|---|---|---|---|---|---|---|---|---|---|---|---|---|---|---|---|---|---|---|---|---|---|---|---|---|---|---|---|---|---|---|---|---|---|---|---|---|---|---|---|---|---|---|---|---|---|---|---|---|---|---|---|---|---|---|---|---|---|---|---|---|---|---|---|---|
| % | % | % | ||||||||||||||||||||||||||||||||||||||||||||||||||||||||||||||||||||||||||||||||||||||||||||||||||
| Domestic problems | ||||||||||||||||||||||||||||||||||||||||||||||||||||||||||||||||||||||||||||||||||||||||||||||||||||
| Republicans/Lean Republican | 26 | 24 | 26 | |||||||||||||||||||||||||||||||||||||||||||||||||||||||||||||||||||||||||||||||||||||||||||||||||
| Democrats/Lean Democratic | 58 | 53 | 64 | |||||||||||||||||||||||||||||||||||||||||||||||||||||||||||||||||||||||||||||||||||||||||||||||||
| International problems | ||||||||||||||||||||||||||||||||||||||||||||||||||||||||||||||||||||||||||||||||||||||||||||||||||||
| Republicans/Lean Republican | 26 | 29 | 27 | |||||||||||||||||||||||||||||||||||||||||||||||||||||||||||||||||||||||||||||||||||||||||||||||||
| Democrats/Lean Democratic | 64 | 62 | 72 | |||||||||||||||||||||||||||||||||||||||||||||||||||||||||||||||||||||||||||||||||||||||||||||||||
| Recent trend | ||||||||||||||||||||||||||||||||||||||||||||||||||||||||||||||||||||||||||||||||||||||||||||||||||||
| Gallup | ||||||||||||||||||||||||||||||||||||||||||||||||||||||||||||||||||||||||||||||||||||||||||||||||||||
Bottom Line
After several years of Americans' confidence in the federal government -- particularly in the White House and Congress -- wasting away, confidence has rebounded some. This is mainly because Democrats are feeling more positive. Republicans' views of the executive and legislative branches have not changed much; their confidence in each remains low. But their confidence in the judiciary has rebounded some after dropping sharply a year ago.
These trust ratings are highly political, with Democrats and Republicans' views especially dependent on the party occupying the White House. The current pattern of high Democratic confidence and low Republican confidence will likely continue if Democrat Hillary Clinton wins the presidential election. Conversely, partisan confidence levels could reverse if Trump prevails. Meanwhile, confidence in the Supreme Court is mainly dependent on the nature of its big decisions. Any more cases that deeply disappoint the political right could send its confidence rating back down. Otherwise, it seems on course to recover.
Historical data are available in Gallup Analytics.
Survey Methods
Results for this Gallup poll are based on telephone interviews conducted Sept. 7-11, 2016, with a random sample of 1,020 adults, aged 18 and older, living in all 50 U.S. states and the District of Columbia. For results based on the total sample of national adults, the margin of sampling error is ±4 percentage points at the 95% confidence level. All reported margins of sampling error include computed design effects for weighting.
Each sample of national adults includes a minimum quota of 60% cellphone respondents and 40% landline respondents, with additional minimum quotas by time zone within region. Landline and cellular telephone numbers are selected using random-digit-dial methods.
Learn more about how the Gallup Poll Social Series works.


