Story Highlights
- Seven in 10 U.S. voters say 2016 election matters more than prior ones
- Republicans lead Democrats in this belief, 80% to 69%
- Party out of the White House typically thinks election matters more
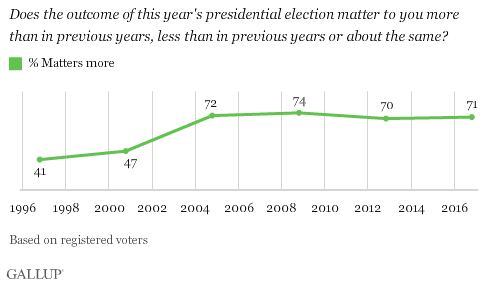
PRINCETON, N.J. -- Seven in 10 U.S. voters say the outcome of the presidential election matters more to them this year than it did in prior election years -- in line with what Gallup recorded at this stage of the past three presidential campaigns. However, before 2004, voters were far less likely to believe presidential elections meant that much.

Across the 20 years Gallup has asked this question, including in the latest update -- from an Oct. 25-26, 2016, poll -- few voters say the election matters less than in the past, including just 3% this year. Instead, most of those who don't think it matters more (29% this year) say it matters about the same.
Belief Election Matters Relates to Turnout
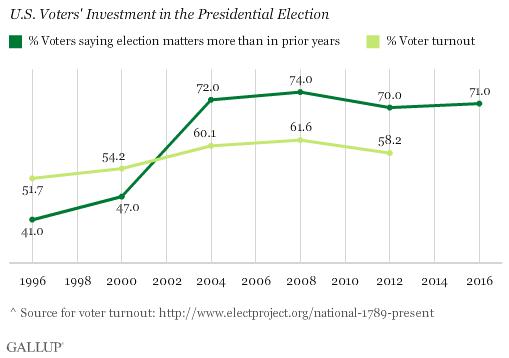
Since 1996, the percentage of Americans who show up at the polls on Election Day has followed the same trajectory as voter attitudes about the importance of each election. In 1996 and 2000, when less than half of voters believed the election was especially important, voter turnout failed to reach 55%. But from 2004 to 2012, when 70% or more of voters have consistently said the election matters more than usual, turnout among the U.S. voting-age population has been at or near 60%.

Party Out of Power Cares More
Given the historical pattern, turnout in the 2016 election could be on the high side, similar to 2012. However, the effect on the election's outcome depends on whether one party turns out at a higher rate than the other. That is not readily forecast from the trend in Republicans' and Democrats' answers to whether the election matters more than in the past.
Voters aligned with the party in opposition to the sitting president's party typically think the election is more important than those affiliated with the president's party. So Republicans were more likely to think the outcome was highly significant in 2000 and 2012, when the sitting president was a Democrat, and Democrats were more likely to feel this way in 2004 and 2008, when a Republican was in office. However, in only half of those years -- 2000 and 2008 -- did the party with the higher percentage saying the election mattered more win the election.
Currently, 80% of Republicans and 69% of Democrats say the election's outcome matters more to them than it did in prior elections. While that 11-percentage-point margin may seem advantageous for Republican nominee Donald Trump, Republicans' even greater 19-point advantage on this measure in 2012 did not correspond with the GOP winning the White House. Likewise, Democrats had the edge in 2004 and 2008, but lost in 2004 while winning in 2008. In 2000, Republicans had the advantage and won in the Electoral College but lost the popular vote.
| Democrats | Independents | Republicans | Democratic advantage | ||||||||||||||||||||||||||||||||||||||||||||||||||||||||||||||||||||||||||||||||||||||||||||||||
|---|---|---|---|---|---|---|---|---|---|---|---|---|---|---|---|---|---|---|---|---|---|---|---|---|---|---|---|---|---|---|---|---|---|---|---|---|---|---|---|---|---|---|---|---|---|---|---|---|---|---|---|---|---|---|---|---|---|---|---|---|---|---|---|---|---|---|---|---|---|---|---|---|---|---|---|---|---|---|---|---|---|---|---|---|---|---|---|---|---|---|---|---|---|---|---|---|---|---|---|
| % | % | % | pct. pts. | ||||||||||||||||||||||||||||||||||||||||||||||||||||||||||||||||||||||||||||||||||||||||||||||||
| 2016 | 69 | 66 | 80 | -11 | |||||||||||||||||||||||||||||||||||||||||||||||||||||||||||||||||||||||||||||||||||||||||||||||
| 2012 | 66 | 62 | 85 | -19 | |||||||||||||||||||||||||||||||||||||||||||||||||||||||||||||||||||||||||||||||||||||||||||||||
| 2008 | 80 | 68 | 74 | 6 | |||||||||||||||||||||||||||||||||||||||||||||||||||||||||||||||||||||||||||||||||||||||||||||||
| 2004 | 77 | 73 | 69 | 8 | |||||||||||||||||||||||||||||||||||||||||||||||||||||||||||||||||||||||||||||||||||||||||||||||
| 2000 | 45 | 43 | 52 | -7 | |||||||||||||||||||||||||||||||||||||||||||||||||||||||||||||||||||||||||||||||||||||||||||||||
| 1996 | 45 | 34 | 47 | -2 | |||||||||||||||||||||||||||||||||||||||||||||||||||||||||||||||||||||||||||||||||||||||||||||||
| Gallup | |||||||||||||||||||||||||||||||||||||||||||||||||||||||||||||||||||||||||||||||||||||||||||||||||||
Bottom Line
Believing that each presidential election is more consequential than the last has been the new normal for voters since 2004 and may be one reason for higher voter turnout in recent elections. This year is no exception, and it would not be surprising to find that overall turnout is high.
As Gallup has noted previously, voters' greater psychological investment in the presidential election since 2004 may reflect intensifying problems facing the country, including terrorism, the Iraq War and a struggling economy. It may also be a reaction to the 2000 election, whose outcome was decided by a handful of votes in Florida after an extensive recount. The rise of social media could be another factor affecting voters, possibly contributing to heightened political awareness and polarization. Whatever the cause, the stakes feel high for about eight in 10 Republicans and seven in 10 Democrats, enough to keep the country on edge for the remaining week of the campaign, but not necessarily dictating who will win.
Historical data are available in Gallup Analytics.
Survey Methods
Results for this Gallup poll are based on telephone interviews conducted Oct. 25-26, 2016, on the Gallup U.S. Daily survey, with a random sample of 926 registered voters, aged 18 and older, living in all 50 U.S. states and the District of Columbia. For results based on the total sample of national adults, the margin of sampling error is ±4 percentage points at the 95% confidence level. All reported margins of sampling error include computed design effects for weighting.
Each sample of national adults includes a minimum quota of 60% cellphone respondents and 40% landline respondents, with additional minimum quotas by time zone within region. Landline and cellular telephone numbers are selected using random-digit-dial methods.
View survey methodology, complete question responses and trends.
Learn more about how the Gallup U.S. Daily works.


