Story Highlights
- Americans maintain slightly positive views of economy after the election
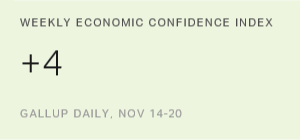
- Index at +4, rivals the January 2015 post-recession high
- Both current conditions, economic outlook components are positive
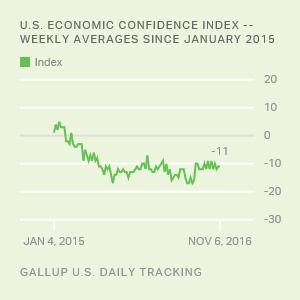
WASHINGTON, D.C. -- Gallup's U.S. Economic Confidence Index was +4 for the week ending Nov. 20, the first full week of interviewing after the Nov. 8 presidential election. This is the first positive weekly reading in more than a year and a half.
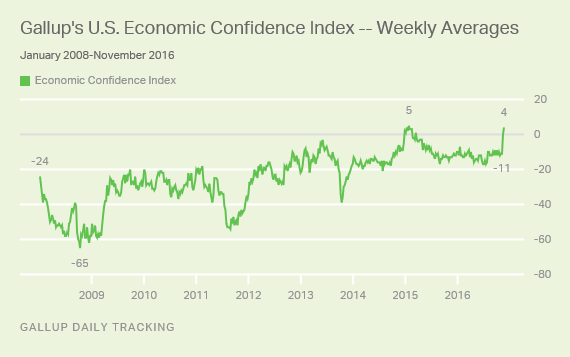
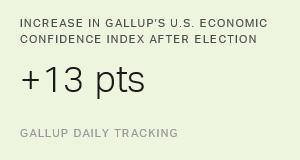
Last week, Gallup reported an improvement in Americans' views of the economy in the first few days after the presidential election. This moved the weekly average from -11 in the last full week before the election to 0 for the week of Nov. 7-13, which included both pre-election and post-election interviewing.
Gallup's U.S. Economic Confidence Index is the average of two components: how Americans rate current economic conditions and whether they feel the economy is improving or getting worse. The index has a theoretical maximum of +100 if all Americans were to say the economy is doing well and improving, and a theoretical minimum of -100 if all Americans were to say the economy is doing poorly and getting worse. If Americans are equally balanced in their positive and negative views on both measures, the score would be 0, as it was the week ending Nov. 13.
The index has registered a handful of positive weekly averages over Gallup's U.S. Daily tracking trend beginning in 2008. All of these occurred during a three-month stretch from late December 2014 to mid-March 2015 after a sustained period of declining gas prices. The latest figure rivals the record-high weekly average of +5 recorded in late January 2015.
In the year leading up to the election, Americans were consistently negative about the economy, with weekly index scores ranging from -7 to -17.
Since Donald Trump's victory in the presidential election, Republicans have become substantially more positive about the economy -- particularly about its direction -- while Democrats' former optimism has collapsed.
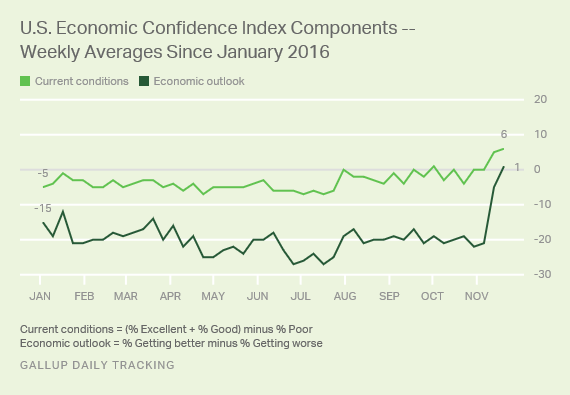
Both Current Conditions, Economic Outlook Components in Positive Territory
Twenty-nine percent of Americans rated the economy as "excellent" or "good" last week, while 23% said it was "poor," resulting in a current conditions index of +6. That is up from a score of 0 the week before the election and one point shy of the high of +7 recorded in January 2008.
The economic outlook component experienced an even greater improvement. For the week ending Nov. 20, this component edged into positive territory at +1, compared with -5 one week earlier and -21 the week before the election. The latest score is the result of 47% of Americans saying economic conditions in the country are "getting better" and 46% saying they are "getting worse."
Bottom Line
Americans' confidence in the economy is now higher than it has been for most of Gallup's tracking trend over the past nine years.
The heightened confidence places Trump on much better footing than what his predecessor Barack Obama started his first term with, but it could also set a high bar for the incoming president's performance. If Trump rises to the challenge of further improving the U.S. economy, the index could reach heights it hasn't touched in nearly a decade. But the high hopes could also lead to disappointment if Americans feel Trump hasn't kept his promises of economic progress, which could cause the economic outlook component to retreat into negative territory.
Historical data are available in Gallup Analytics.
Survey Methods
Results for this Gallup poll are based on telephone interviews conducted Nov. 14-20, 2016, on the Gallup U.S. Daily survey, with a random sample of 3,546 adults, aged 18 and older, living in all 50 U.S. states and the District of Columbia. For results based on the total sample of national adults, the margin of sampling error is ±2 percentage points at the 95% confidence level. All reported margins of sampling error include computed design effects for weighting.
Each sample of national adults includes a minimum quota of 60% cellphone respondents and 40% landline respondents, with additional minimum quotas by time zone within region. Landline and cellular telephone numbers are selected using random-digit-dial methods.
Learn more about how the Gallup U.S. Daily works.