Story Highlights
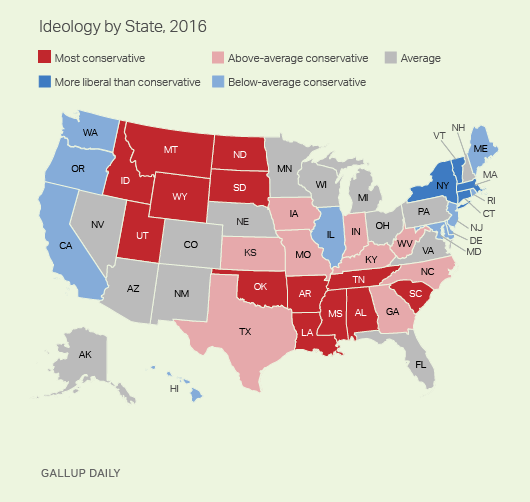
- Conservative advantage highest in South and Mountain West
- Residents in states on both coasts most liberal
- Most states at least slightly less conservative than in 2009
WASHINGTON, D.C. -- Wyoming, North Dakota and Mississippi are the most right-leaning states in the nation, with self-identified conservatives in each state outnumbering self-identified liberals by more than 30 percentage points. Vermont is the most liberal state, with liberals outnumbering conservatives by 14 percentage points, followed by Massachusetts, Connecticut and New York.
| Most conservative states | Conservative advantage | Least conservative states | Conservative advantage | ||||||||||||||||||||||||||||||||||||||||||||||||||||||||||||||||||||||||||||||||||||||||||||||||
|---|---|---|---|---|---|---|---|---|---|---|---|---|---|---|---|---|---|---|---|---|---|---|---|---|---|---|---|---|---|---|---|---|---|---|---|---|---|---|---|---|---|---|---|---|---|---|---|---|---|---|---|---|---|---|---|---|---|---|---|---|---|---|---|---|---|---|---|---|---|---|---|---|---|---|---|---|---|---|---|---|---|---|---|---|---|---|---|---|---|---|---|---|---|---|---|---|---|---|---|
| Wyoming | +35 | Vermont | -14 | ||||||||||||||||||||||||||||||||||||||||||||||||||||||||||||||||||||||||||||||||||||||||||||||||
| North Dakota | +31 | Massachusetts | -8 | ||||||||||||||||||||||||||||||||||||||||||||||||||||||||||||||||||||||||||||||||||||||||||||||||
| Mississippi | +31 | Connecticut | -4 | ||||||||||||||||||||||||||||||||||||||||||||||||||||||||||||||||||||||||||||||||||||||||||||||||
| Oklahoma | +30 | New York | -2 | ||||||||||||||||||||||||||||||||||||||||||||||||||||||||||||||||||||||||||||||||||||||||||||||||
| Alabama | +30 | Washington | 0 | ||||||||||||||||||||||||||||||||||||||||||||||||||||||||||||||||||||||||||||||||||||||||||||||||
| Arkansas | +28 | Maine | 0 | ||||||||||||||||||||||||||||||||||||||||||||||||||||||||||||||||||||||||||||||||||||||||||||||||
| Idaho | +28 | California | +1 | ||||||||||||||||||||||||||||||||||||||||||||||||||||||||||||||||||||||||||||||||||||||||||||||||
| Louisiana | +27 | Oregon | +1 | ||||||||||||||||||||||||||||||||||||||||||||||||||||||||||||||||||||||||||||||||||||||||||||||||
| Montana | +26 | Maryland | +1 | ||||||||||||||||||||||||||||||||||||||||||||||||||||||||||||||||||||||||||||||||||||||||||||||||
| Utah | +26 | Hawaii | +2 | ||||||||||||||||||||||||||||||||||||||||||||||||||||||||||||||||||||||||||||||||||||||||||||||||
| Tennessee | +26 | ||||||||||||||||||||||||||||||||||||||||||||||||||||||||||||||||||||||||||||||||||||||||||||||||||
| Gallup Daily | |||||||||||||||||||||||||||||||||||||||||||||||||||||||||||||||||||||||||||||||||||||||||||||||||||
The top 10 conservative states in 2016 are nearly the same as the top 10 in 2015, except Montana and Tennessee have replaced South Dakota on the list. Eight of the top 10 most liberal states in 2016 were on the top 10 list in 2015. Maine and Maryland have replaced Rhode Island and New Jersey.
These results are based on Gallup Daily tracking interviews throughout 2016 with 177,788 U.S. adults. Gallup asks Americans whether their political views are very conservative, conservative, moderate, liberal or very liberal. The results displayed are based on combining the two conservative categories and the two liberal categories, and then subtracting the difference. The complete state-by-state results for all categories are displayed at the end of this article.
The ideological differences between states can be substantial, with a 49-point difference in net conservatism between the most conservative state (Wyoming) and the most liberal (Vermont). In Wyoming, 49% of residents in 2016 identified as conservative, while 14% identified as liberal -- or +35 conservative. At the other end of the ideological spectrum, 26% of Vermont residents identified as conservative and 40% as liberal, or -14 conservative.
The country as a whole remains more conservative than liberal, but this conservative advantage has been narrowing in recent years, mainly because more Americans are identifying as liberal and fewer as moderate. The continued conservative advantage, as well as the narrowing of that advantage, are both evident at the state level.
- Conservatives today outnumber liberals in 44 states. In a number of states, the conservative skew is pronounced, including five states in which conservatives outnumber liberals by 30 points or more and 13 others where the conservative advantage is at least 20 points. Only in four states (Vermont, Massachusetts, Connecticut and New York) do liberals outnumber conservatives, and in another two (Washington and Maine) liberals and conservatives are evenly matched. In several other states, the conservative advantage is only one or two points.
- Despite the numerical dominance of conservative states, the conservative advantage has decreased within most states, with 42 states becoming at least marginally less conservative since 2009. Five of these states -- Vermont, Maine, Delaware, Connecticut and Alaska -- saw their net-conservative leanings shrink by 10 points or more over the past eight years. Bucking the trend are Wyoming, North Dakota, Montana and Missouri, all of which have become at least slightly more conservative since 2009. Four other states have the same conservative advantage today as eight years ago.
The mostly leftward movement on ideology since 2009 contrasts with the movement on partisanship since then, which has been all in the Republican direction.
Conservative States Mostly in South; Liberal States on Coasts
The geographic distribution of ideology follows the red-blue voting pattern evident in recent elections. The most conservative states are all located in the South (Mississippi, Alabama, Louisiana, Arkansas, Tennessee and South Carolina), in the Mountain West (Utah, Wyoming and Idaho) and in the Great Plains (North Dakota and South Dakota), with Oklahoma straddling the Great Plains and Southern regions. The most liberal states are all located on the East and West Coasts -- in New England (Vermont, Massachusetts, Connecticut and Maine), the Middle Atlantic (New York and Maryland) and the far West (Washington, California, Oregon and Hawaii).
Bottom Line
Residents in most U.S. states tilt more conservative than liberal -- although as is the case for the country as a whole, this conservative advantage has narrowed in many states with the rising number of Americans identifying as liberals.
What it means to be a conservative and a liberal, of course, can vary significantly among those choosing these broad labels. Many Americans can be conservative or liberal on social issues while holding opposite views on economic issues. But the basic ideological labels are useful in picking up political trends, and in general, the most conservative states are also those that lean Republican in terms of residents' party identification and that tend to vote for Republican presidential candidates. Along these same lines, the regional variations in ideology provide further evidence of the persistent geographical nature of politics in the U.S. today.
These data are available in Gallup Analytics.
Survey Methods
Results for this Gallup poll are based on telephone interviews conducted Jan. 2-Dec. 30, 2016, on the Gallup U.S. Daily survey, with a random sample of 177,788 adults, aged 18 and older, living in all 50 U.S. states and the District of Columbia. Margins of error for individual states are no greater than ±6 percentage points and are ±3 percentage points in most states. All reported margins of sampling error include computed design effects for weighting.
Each sample of national adults includes a minimum quota of 60% cellphone respondents and 40% landline respondents, with additional minimum quotas by time zone within region. Landline and cellular telephone numbers are selected using random-digit-dial methods.
Learn more about how the Gallup U.S. Daily works.
| Conservative | Moderate | Liberal | Conservative advantage | N size | |||||||||||||||||||||||||||||||||||||||||||||||||||||||||||||||||||||||||||||||||||||||||||||||
|---|---|---|---|---|---|---|---|---|---|---|---|---|---|---|---|---|---|---|---|---|---|---|---|---|---|---|---|---|---|---|---|---|---|---|---|---|---|---|---|---|---|---|---|---|---|---|---|---|---|---|---|---|---|---|---|---|---|---|---|---|---|---|---|---|---|---|---|---|---|---|---|---|---|---|---|---|---|---|---|---|---|---|---|---|---|---|---|---|---|---|---|---|---|---|---|---|---|---|---|
| % | % | % | pct. pts. | ||||||||||||||||||||||||||||||||||||||||||||||||||||||||||||||||||||||||||||||||||||||||||||||||
| Wyoming | 49 | 33 | 14 | +35 | 529 | ||||||||||||||||||||||||||||||||||||||||||||||||||||||||||||||||||||||||||||||||||||||||||||||
| North Dakota | 43 | 42 | 12 | +31 | 567 | ||||||||||||||||||||||||||||||||||||||||||||||||||||||||||||||||||||||||||||||||||||||||||||||
| Mississippi | 46 | 33 | 15 | +31 | 1,682 | ||||||||||||||||||||||||||||||||||||||||||||||||||||||||||||||||||||||||||||||||||||||||||||||
| Oklahoma | 46 | 33 | 16 | +30 | 2,720 | ||||||||||||||||||||||||||||||||||||||||||||||||||||||||||||||||||||||||||||||||||||||||||||||
| Alabama | 47 | 31 | 17 | +30 | 2,958 | ||||||||||||||||||||||||||||||||||||||||||||||||||||||||||||||||||||||||||||||||||||||||||||||
| Arkansas | 45 | 34 | 17 | +28 | 1,926 | ||||||||||||||||||||||||||||||||||||||||||||||||||||||||||||||||||||||||||||||||||||||||||||||
| Idaho | 45 | 35 | 17 | +28 | 1,159 | ||||||||||||||||||||||||||||||||||||||||||||||||||||||||||||||||||||||||||||||||||||||||||||||
| Louisiana | 44 | 34 | 17 | +27 | 2,409 | ||||||||||||||||||||||||||||||||||||||||||||||||||||||||||||||||||||||||||||||||||||||||||||||
| Montana | 44 | 34 | 18 | +26 | 1,086 | ||||||||||||||||||||||||||||||||||||||||||||||||||||||||||||||||||||||||||||||||||||||||||||||
| Utah | 44 | 35 | 18 | +26 | 2,027 | ||||||||||||||||||||||||||||||||||||||||||||||||||||||||||||||||||||||||||||||||||||||||||||||
| Tennessee | 43 | 34 | 17 | +26 | 4,227 | ||||||||||||||||||||||||||||||||||||||||||||||||||||||||||||||||||||||||||||||||||||||||||||||
| South Carolina | 42 | 36 | 17 | +25 | 2,795 | ||||||||||||||||||||||||||||||||||||||||||||||||||||||||||||||||||||||||||||||||||||||||||||||
| South Dakota | 41 | 38 | 16 | +25 | 539 | ||||||||||||||||||||||||||||||||||||||||||||||||||||||||||||||||||||||||||||||||||||||||||||||
| Kentucky | 42 | 34 | 20 | +22 | 2,726 | ||||||||||||||||||||||||||||||||||||||||||||||||||||||||||||||||||||||||||||||||||||||||||||||
| Kansas | 40 | 37 | 19 | +21 | 1,793 | ||||||||||||||||||||||||||||||||||||||||||||||||||||||||||||||||||||||||||||||||||||||||||||||
| Missouri | 42 | 34 | 21 | +21 | 3,452 | ||||||||||||||||||||||||||||||||||||||||||||||||||||||||||||||||||||||||||||||||||||||||||||||
| North Carolina | 40 | 34 | 20 | +20 | 5,808 | ||||||||||||||||||||||||||||||||||||||||||||||||||||||||||||||||||||||||||||||||||||||||||||||
| Texas | 40 | 35 | 20 | +20 | 13,565 | ||||||||||||||||||||||||||||||||||||||||||||||||||||||||||||||||||||||||||||||||||||||||||||||
| Iowa | 40 | 37 | 21 | +19 | 2,074 | ||||||||||||||||||||||||||||||||||||||||||||||||||||||||||||||||||||||||||||||||||||||||||||||
| Indiana | 39 | 36 | 20 | +19 | 3,905 | ||||||||||||||||||||||||||||||||||||||||||||||||||||||||||||||||||||||||||||||||||||||||||||||
| Georgia | 39 | 36 | 20 | +19 | 5,282 | ||||||||||||||||||||||||||||||||||||||||||||||||||||||||||||||||||||||||||||||||||||||||||||||
| West Virginia | 41 | 34 | 22 | +19 | 1,051 | ||||||||||||||||||||||||||||||||||||||||||||||||||||||||||||||||||||||||||||||||||||||||||||||
| Nebraska | 39 | 35 | 21 | +18 | 1,404 | ||||||||||||||||||||||||||||||||||||||||||||||||||||||||||||||||||||||||||||||||||||||||||||||
| Ohio | 37 | 37 | 21 | +16 | 6,354 | ||||||||||||||||||||||||||||||||||||||||||||||||||||||||||||||||||||||||||||||||||||||||||||||
| Virginia | 37 | 36 | 22 | +15 | 5,123 | ||||||||||||||||||||||||||||||||||||||||||||||||||||||||||||||||||||||||||||||||||||||||||||||
| Arizona | 36 | 37 | 22 | +14 | 4,402 | ||||||||||||||||||||||||||||||||||||||||||||||||||||||||||||||||||||||||||||||||||||||||||||||
| Nevada | 36 | 35 | 23 | +13 | 1,424 | ||||||||||||||||||||||||||||||||||||||||||||||||||||||||||||||||||||||||||||||||||||||||||||||
| Florida | 36 | 35 | 23 | +13 | 10,720 | ||||||||||||||||||||||||||||||||||||||||||||||||||||||||||||||||||||||||||||||||||||||||||||||
| New Mexico | 36 | 37 | 23 | +13 | 1,451 | ||||||||||||||||||||||||||||||||||||||||||||||||||||||||||||||||||||||||||||||||||||||||||||||
| Pennsylvania | 36 | 36 | 24 | +12 | 8,021 | ||||||||||||||||||||||||||||||||||||||||||||||||||||||||||||||||||||||||||||||||||||||||||||||
| Wisconsin | 36 | 37 | 24 | +12 | 3,433 | ||||||||||||||||||||||||||||||||||||||||||||||||||||||||||||||||||||||||||||||||||||||||||||||
| Alaska | 34 | 37 | 23 | +11 | 545 | ||||||||||||||||||||||||||||||||||||||||||||||||||||||||||||||||||||||||||||||||||||||||||||||
| Michigan | 34 | 36 | 24 | +10 | 4,986 | ||||||||||||||||||||||||||||||||||||||||||||||||||||||||||||||||||||||||||||||||||||||||||||||
| New Hampshire | 34 | 37 | 25 | +9 | 718 | ||||||||||||||||||||||||||||||||||||||||||||||||||||||||||||||||||||||||||||||||||||||||||||||
| Minnesota | 34 | 37 | 25 | +9 | 3,273 | ||||||||||||||||||||||||||||||||||||||||||||||||||||||||||||||||||||||||||||||||||||||||||||||
| Colorado | 35 | 36 | 26 | +9 | 3,539 | ||||||||||||||||||||||||||||||||||||||||||||||||||||||||||||||||||||||||||||||||||||||||||||||
| Delaware | 32 | 38 | 25 | +7 | 505 | ||||||||||||||||||||||||||||||||||||||||||||||||||||||||||||||||||||||||||||||||||||||||||||||
| Illinois | 32 | 36 | 28 | +4 | 5,513 | ||||||||||||||||||||||||||||||||||||||||||||||||||||||||||||||||||||||||||||||||||||||||||||||
| New Jersey | 31 | 37 | 27 | +4 | 4,662 | ||||||||||||||||||||||||||||||||||||||||||||||||||||||||||||||||||||||||||||||||||||||||||||||
| Rhode Island | 30 | 41 | 26 | +4 | 600 | ||||||||||||||||||||||||||||||||||||||||||||||||||||||||||||||||||||||||||||||||||||||||||||||
| Hawaii | 28 | 41 | 26 | +2 | 578 | ||||||||||||||||||||||||||||||||||||||||||||||||||||||||||||||||||||||||||||||||||||||||||||||
| Maryland | 29 | 38 | 28 | +1 | 3,201 | ||||||||||||||||||||||||||||||||||||||||||||||||||||||||||||||||||||||||||||||||||||||||||||||
| Oregon | 31 | 36 | 30 | +1 | 2,888 | ||||||||||||||||||||||||||||||||||||||||||||||||||||||||||||||||||||||||||||||||||||||||||||||
| California | 30 | 35 | 29 | +1 | 17,506 | ||||||||||||||||||||||||||||||||||||||||||||||||||||||||||||||||||||||||||||||||||||||||||||||
| Maine | 31 | 33 | 31 | 0 | 956 | ||||||||||||||||||||||||||||||||||||||||||||||||||||||||||||||||||||||||||||||||||||||||||||||
| Washington | 30 | 36 | 30 | 0 | 4,421 | ||||||||||||||||||||||||||||||||||||||||||||||||||||||||||||||||||||||||||||||||||||||||||||||
| New York | 29 | 35 | 31 | -2 | 10,452 | ||||||||||||||||||||||||||||||||||||||||||||||||||||||||||||||||||||||||||||||||||||||||||||||
| Connecticut | 27 | 38 | 31 | -4 | 2,019 | ||||||||||||||||||||||||||||||||||||||||||||||||||||||||||||||||||||||||||||||||||||||||||||||
| Massachusetts | 25 | 37 | 33 | -8 | 3,868 | ||||||||||||||||||||||||||||||||||||||||||||||||||||||||||||||||||||||||||||||||||||||||||||||
| Vermont | 26 | 32 | 40 | -14 | 501 | ||||||||||||||||||||||||||||||||||||||||||||||||||||||||||||||||||||||||||||||||||||||||||||||
| Gallup Daily | |||||||||||||||||||||||||||||||||||||||||||||||||||||||||||||||||||||||||||||||||||||||||||||||||||