Story Highlights
- Overall U.S. homeownership down from 71% in 2001-2009 to 63% since then
- Decline evident among all income groups and in all U.S. regions
- Homeownership rates steady among adults aged 65 and older
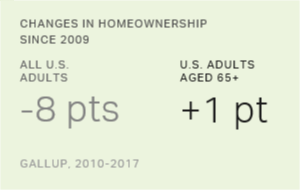
WASHINGTON, D.C. -- U.S. homeownership rates have declined among most major demographic subgroups -- including by household income and region -- except among older Americans, whose homeownership rates have held steady. Overall, homeownership is down eight percentage points, from 71% to 63%.
| 2001-2009 | 2010-2017 | Change | ||||||||||||||||||||||||||||||||||||||||||||||||||||||||||||||||||||||||||||||||||||||||||||||||||
|---|---|---|---|---|---|---|---|---|---|---|---|---|---|---|---|---|---|---|---|---|---|---|---|---|---|---|---|---|---|---|---|---|---|---|---|---|---|---|---|---|---|---|---|---|---|---|---|---|---|---|---|---|---|---|---|---|---|---|---|---|---|---|---|---|---|---|---|---|---|---|---|---|---|---|---|---|---|---|---|---|---|---|---|---|---|---|---|---|---|---|---|---|---|---|---|---|---|---|---|---|
| % | % | pct. pts. | ||||||||||||||||||||||||||||||||||||||||||||||||||||||||||||||||||||||||||||||||||||||||||||||||||
| U.S. adults | 71 | 63 | -8 | |||||||||||||||||||||||||||||||||||||||||||||||||||||||||||||||||||||||||||||||||||||||||||||||||
| Age | ||||||||||||||||||||||||||||||||||||||||||||||||||||||||||||||||||||||||||||||||||||||||||||||||||||
| 18-29 years | 36 | 26 | -10 | |||||||||||||||||||||||||||||||||||||||||||||||||||||||||||||||||||||||||||||||||||||||||||||||||
| 30-49 years | 73 | 63 | -10 | |||||||||||||||||||||||||||||||||||||||||||||||||||||||||||||||||||||||||||||||||||||||||||||||||
| 50-64 years | 84 | 77 | -7 | |||||||||||||||||||||||||||||||||||||||||||||||||||||||||||||||||||||||||||||||||||||||||||||||||
| 65+ years | 81 | 82 | +1 | |||||||||||||||||||||||||||||||||||||||||||||||||||||||||||||||||||||||||||||||||||||||||||||||||
| Annual household income | ||||||||||||||||||||||||||||||||||||||||||||||||||||||||||||||||||||||||||||||||||||||||||||||||||||
| Less than $30,000 | 48 | 36 | -12 | |||||||||||||||||||||||||||||||||||||||||||||||||||||||||||||||||||||||||||||||||||||||||||||||||
| $30,000-$74,999 | 74 | 64 | -10 | |||||||||||||||||||||||||||||||||||||||||||||||||||||||||||||||||||||||||||||||||||||||||||||||||
| $75,000-$99,999 | 88 | 78 | -10 | |||||||||||||||||||||||||||||||||||||||||||||||||||||||||||||||||||||||||||||||||||||||||||||||||
| $100,000-$149,999 | 92 | 87 | -5 | |||||||||||||||||||||||||||||||||||||||||||||||||||||||||||||||||||||||||||||||||||||||||||||||||
| $150,000 or more | 91 | 84 | -7 | |||||||||||||||||||||||||||||||||||||||||||||||||||||||||||||||||||||||||||||||||||||||||||||||||
| Region | ||||||||||||||||||||||||||||||||||||||||||||||||||||||||||||||||||||||||||||||||||||||||||||||||||||
| East | 68 | 60 | -8 | |||||||||||||||||||||||||||||||||||||||||||||||||||||||||||||||||||||||||||||||||||||||||||||||||
| Midwest | 74 | 66 | -8 | |||||||||||||||||||||||||||||||||||||||||||||||||||||||||||||||||||||||||||||||||||||||||||||||||
| South | 71 | 65 | -6 | |||||||||||||||||||||||||||||||||||||||||||||||||||||||||||||||||||||||||||||||||||||||||||||||||
| West | 70 | 59 | -11 | |||||||||||||||||||||||||||||||||||||||||||||||||||||||||||||||||||||||||||||||||||||||||||||||||
| Based on combined data from Gallup's April Economy and Personal Finance surveys | ||||||||||||||||||||||||||||||||||||||||||||||||||||||||||||||||||||||||||||||||||||||||||||||||||||
| Gallup | ||||||||||||||||||||||||||||||||||||||||||||||||||||||||||||||||||||||||||||||||||||||||||||||||||||
These findings are based on data from Gallup's annual Economy and Personal Finance poll, combining results from two periods of those April surveys, specifically 2001 to 2009 and 2010 to 2017. Homeownership grew after 2001, peaking at 73% in 2007 as many bought homes using subprime mortgages. Homeownership held at 70% through 2009 after the housing bubble burst and amid the financial crisis but has not returned to that level since.
Younger adults, low- and middle-income Americans, and those living in the West have experienced above-average drops in homeownership. But declines are apparent among groups with traditionally high ownership rates, including upper-income Americans. Among Americans living in households with incomes of $100,000 or more, homeownership has dropped below 90% since 2009.
Senior citizens have been immune from the trend of declining homeownership. Between 2001 and 2009, an average of 81% owned a home. Since then, 82% report owning their home.
One reason for this stability is that many older Americans may own their home outright because they paid off their mortgage in full or they sold their house and paid cash to buy a smaller, less expensive home. In either case, they would no longer pay substantial monthly mortgage payments, and their ability to afford a home would be less tied to receiving a regular and substantial paycheck than younger Americans' ability to afford a home is.
Also, to a lesser degree, state and federal programs may assist seniors with purchasing or remaining in a home. The federal government provides grants to help low-income Americans, including seniors, find housing. And certain states have programs or tax laws that give seniors property tax relief, making homeownership on a fixed income more affordable for them.
Changing work patterns among seniors may also be a factor in their stable ownership rates. Seniors are the only age group among whom the percentage employed increased rather than decreased between 2001 to 2009 and 2010 to 2017. This change could be related to changing eligibility rules for Social Security benefits as well as a desire among the oldest members of the baby boomer generation to continue working past age 65. Although the vast majority of seniors are not working, more of them are, and thus more may be able to afford mortgage payments if their houses are not yet paid off.
| 2001-2009 | 2010-2017 | Change | ||||||||||||||||||||||||||||||||||||||||||||||||||||||||||||||||||||||||||||||||||||||||||||||||||
|---|---|---|---|---|---|---|---|---|---|---|---|---|---|---|---|---|---|---|---|---|---|---|---|---|---|---|---|---|---|---|---|---|---|---|---|---|---|---|---|---|---|---|---|---|---|---|---|---|---|---|---|---|---|---|---|---|---|---|---|---|---|---|---|---|---|---|---|---|---|---|---|---|---|---|---|---|---|---|---|---|---|---|---|---|---|---|---|---|---|---|---|---|---|---|---|---|---|---|---|---|
| % | % | pct. pts. | ||||||||||||||||||||||||||||||||||||||||||||||||||||||||||||||||||||||||||||||||||||||||||||||||||
| U.S. adults | 60 | 54 | -6 | |||||||||||||||||||||||||||||||||||||||||||||||||||||||||||||||||||||||||||||||||||||||||||||||||
| Age | ||||||||||||||||||||||||||||||||||||||||||||||||||||||||||||||||||||||||||||||||||||||||||||||||||||
| 18-29 years | 64 | 52 | -12 | |||||||||||||||||||||||||||||||||||||||||||||||||||||||||||||||||||||||||||||||||||||||||||||||||
| 30-49 years | 80 | 75 | -5 | |||||||||||||||||||||||||||||||||||||||||||||||||||||||||||||||||||||||||||||||||||||||||||||||||
| 50-64 years | 62 | 58 | -4 | |||||||||||||||||||||||||||||||||||||||||||||||||||||||||||||||||||||||||||||||||||||||||||||||||
| 65+ years | 9 | 14 | +5 | |||||||||||||||||||||||||||||||||||||||||||||||||||||||||||||||||||||||||||||||||||||||||||||||||
| Based on combined data from Gallup's April Economy and Personal Finance surveys | ||||||||||||||||||||||||||||||||||||||||||||||||||||||||||||||||||||||||||||||||||||||||||||||||||||
| Gallup | ||||||||||||||||||||||||||||||||||||||||||||||||||||||||||||||||||||||||||||||||||||||||||||||||||||
Seniors also appear to be better off financially than they were in 2001 to 2009, and thus more are able to afford mortgage payments or the costs of owning a home. The percentage of Americans aged 65 or older in lower-income households -- those having an annual income of less than $30,000 a year -- has dropped substantially. From 2001 to 2009, 46% of senior citizens were in lower-income households. Since then, 33% have been. By contrast, in other age groups, the percentage in lower-income households has not changed much, indicating that by this measure, the financial situation of seniors has improved more than it has for other age groups.
Implications
It is not surprising that homeownership among older Americans is high. Seniors have had many years to work, to save for and purchase a home, and to pay off their mortgage, helping them to become the only major demographic whose homeownership was unaffected by the recent bursting of the housing bubble and the economic financial downturn.
The recent declines in homeownership appear to be a function of many Americans not having the financial means to own a home rather than a result of changes in attitudes about homeownership. The vast majority of non-homeowners, particularly younger adults, say they intend to buy a home in the next decade.
Seniors appear to be largely insulated from the forces driving the homeownership decline. If older Americans own their home outright, then volatile home values, high unemployment or changes in lending practices do not affect them. To the extent that older Americans still owe mortgages or still desire to purchase a new home, the effects of the larger economic trends working against homeownership may be offset by increases in employment and household income among the oldest age group.
It is unclear if older Americans will continue to maintain high homeownership rates. According to research from the Federal Reserve Board, many more seniors today are retiring before their house has been paid off than was the case in the past. And while those in their late 60s or early 70s may be able to continue to work to pay their mortgage, at some point they may be forced to stop working. Some seniors who can no longer work may be able to downsize or draw on savings or Social Security to stay in their home and thus continue to be homeowners. But others may need to rent or move in with relatives if they do not have enough financial resources to remain homeowners.
Historical data are available in Gallup Analytics.
Survey Methods
Results for this Gallup poll are based on combined telephone interviews from Gallup's annual Economy and Personal Finance survey, conducted each April from 2001 to 2017. The combined sample is based on interviews with 16,315 randomly selected adults, aged 18 and older, living in all 50 U.S. states and the District of Columbia. This includes 7,110 interviews conducted between 2001 and 2009 and 9,205 interviews conducted between 2010 and 2017. For results based on these samples of national adults, the margin of sampling error is ±1 percentage point at the 95% confidence level.
All reported margins of sampling error include computed design effects for weighting.
Learn more about how the Gallup Poll Social Series works.