Story Highlights
- Trump's job approval should be near 50% given economic confidence
- Americans' economic outlook is the best it's been since Clinton years
WASHINGTON, D.C. -- President Donald Trump's 38% job approval rating in Gallup's latest weekly average is well below what would be expected based on the relationship between job approval and Americans' views of the economy and their level of satisfaction with the direction of the country for recent presidents. A Gallup analysis of these relationships finds Trump's approval rating is nine to 14 percentage points lower than the predicted values.
December 2017 Economic Ratings and U.S. Satisfaction
| Mood of the country ratings as of December 2017 | Predicted Trump job approval rating | ||||||||||||||||||||||||||||||||||||||||||||||||||||||||||||||||||||||||||||||||||||||||||||||||||
|---|---|---|---|---|---|---|---|---|---|---|---|---|---|---|---|---|---|---|---|---|---|---|---|---|---|---|---|---|---|---|---|---|---|---|---|---|---|---|---|---|---|---|---|---|---|---|---|---|---|---|---|---|---|---|---|---|---|---|---|---|---|---|---|---|---|---|---|---|---|---|---|---|---|---|---|---|---|---|---|---|---|---|---|---|---|---|---|---|---|---|---|---|---|---|---|---|---|---|---|
| % | % | ||||||||||||||||||||||||||||||||||||||||||||||||||||||||||||||||||||||||||||||||||||||||||||||||||
| Believe the economy is getting better | 46 | 54 | |||||||||||||||||||||||||||||||||||||||||||||||||||||||||||||||||||||||||||||||||||||||||||||||||
| Rate current economic conditions excellent/good | 39 | 52 | |||||||||||||||||||||||||||||||||||||||||||||||||||||||||||||||||||||||||||||||||||||||||||||||||
| Satisfied with the direction of the U.S. | 29 | 47 | |||||||||||||||||||||||||||||||||||||||||||||||||||||||||||||||||||||||||||||||||||||||||||||||||
| GALLUP | |||||||||||||||||||||||||||||||||||||||||||||||||||||||||||||||||||||||||||||||||||||||||||||||||||
These estimates are based on a comparison of the two-way relationships between each metric and presidential job approval from 1997 through 2016. This spans President Bill Clinton's second term (the first year the economic outlook measure is available on a consistent basis) and the presidencies of George W. Bush and Barack Obama.
Gallup's most recent coincident measures of Americans' views of the economy and their satisfaction with the direction of the country are from December 2017. Using these values to predict Trump's job approval rating results in a range between 47% and 54%.
More specifically, Trump's predicted approval rating is 54%, based on the 46% of Americans who think the economy is getting better. It is 52% going by the 39% who rate current economic conditions excellent or good. Alternatively, it is 47% based on the 29% of Americans who are satisfied with the way things are going in the U.S.
Presidential approval has been more closely related in Gallup trends to U.S. satisfaction than to either economic metric. Thus, all other things being equal, the historical relationships predict that Trump's approval rating right now should be closer to 47% than 54%. However, in either case, the target is significantly higher than his approval rating is today.
U.S. Mood Is in Trump's Favor
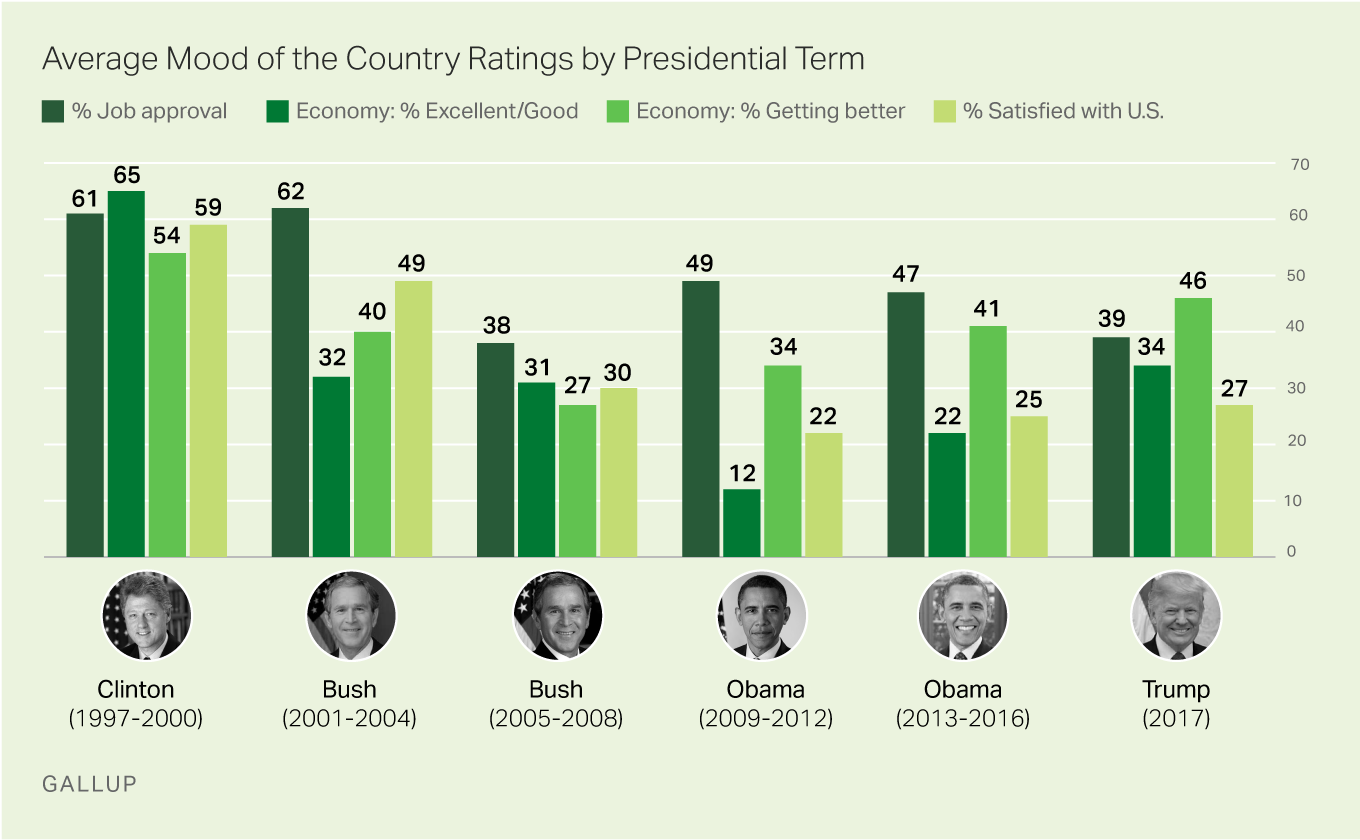
The accompanying graph displays the average economic, satisfaction and approval ratings during each of the past five presidential terms, as well as in Trump's first year in office. This helps illustrate the degree to which Trump's job approval rating is depressed relative to the other metrics.

Trump's 39% average approval rating for all of 2017 lagged behind the percentage of Americans saying the economy was getting better (46%) and barely matched the percentage rating the economy excellent or good (34%). It was only marginally higher than U.S. satisfaction (27%).
By contrast, Obama's average job approval rating in both of his terms, as well as Bush's average approval rating in his first term, soared above the contemporaneous economic and satisfaction ratings, reflecting unique circumstances for each. Bush's first-term approval ratings were heavily influenced by 9/11, somewhat separating his job score from the less-than-optimal economic circumstances in the country at the time. Obama inherited an economic crisis when he took office and was somewhat shielded from blame for the duration of his presidency, as a result.
Bush had a much lower average job approval rating in his second term than in his first, in part reflecting mounting economic problems and public opposition to the Iraq War.
Clinton's second-term sets the high bar for these metrics, with his average approval rating exceeding 60%, coinciding with the highest recent presidential term averages for U.S. satisfaction and economic confidence.
Bottom Line
Every presidency is unique because each is defined by different economic, political and geopolitical circumstances -- not all of which are under a president's control. Still, all presidents are eventually measured, at least in part, by the state of the economy as well as Americans' sense of whether the country is headed in the right direction.
Trump came into office with a much better economy than Obama did, although GDP remained sluggish. Yet despite improved consumer attitudes about the economy in 2017, Trump's average first-year job approval rating was historically low.
Many factors may play into this including public reaction to Trump's initial failed effort to repeal Obamacare, congressional investigations into the Trump campaign's ties to Russia, Trump's controversial firing of FBI Director James Comey, and a record number of staff changes in the White House, to name a few. However, the key reason for Trump's lower-than-predicted job approval is likely his favorability rating, which, similar to his approval rating, has been historically low since the start of 2017. That is also reflected in Trump's subpar character ratings.
Whatever the reasons, Trump's approval rating is failing to live up to the level predicted by Americans' confidence in the economy and broader satisfaction with the direction of the U.S.
Survey Methods
This analysis is based annual averages of Americans' rating of the economy, their outlook for the economy, satisfaction with the U.S. and presidential job approval from 1997 through 2017. Job approval and the economic ratings are based on monthly Gallup standalone polls from 1997 through 2008 and Gallup Daily tracking results (monthly averages) from 2009 through 2017. The U.S. satisfaction ratings are based on Gallup standalone polls from 1997 through 2017. All 1997 to 2008 averages are based on the subset of polls conducted each year in which all four measures were asked in the same survey.
For the 2017 results, each sample of national adults includes a minimum quota of 70% cellphone respondents and 30% landline respondents, with additional minimum quotas by time zone within region. Landline and cellular telephone numbers are selected using random-digit-dial methods.
Learn more about how the Gallup Poll Social Series works.
Learn more about how the Gallup U.S. Daily works.


