Story Highlights
- Nineteen states are solidly Democratic or lean Democratic
- Sixteen states are solidly Republican or lean Republican
- Five states moved from competitive to Democratic
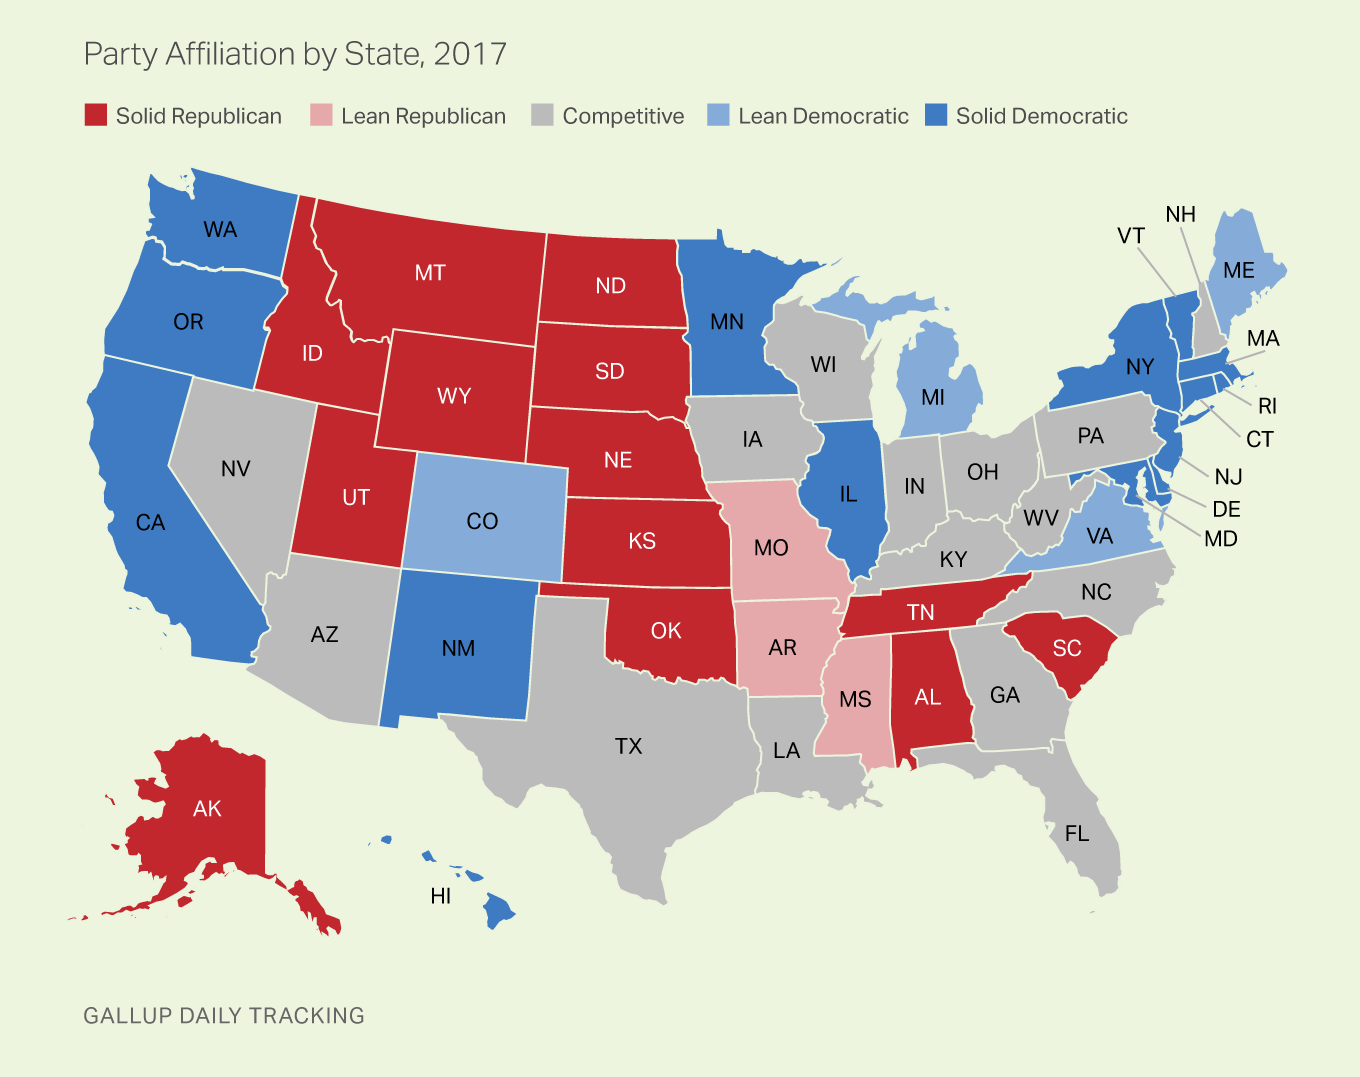
WASHINGTON, D.C. -- For the first time in three years, more states can be considered Democratic than Republican, based on residents' 2017 self-reported party preferences. Nineteen states, up from 14 in 2016, were solidly Democratic or leaned Democratic, while 16 states, down from 21 in 2016, were solidly Republican or leaned that way.
| Solid Democratic | Lean Democratic | Competitive | Lean Republican | Solid Republican | Net Democratic | ||||||||||||||||||||||||||||||||||||||||||||||||||||||||||||||||||||||||||||||||||||||||||||||
|---|---|---|---|---|---|---|---|---|---|---|---|---|---|---|---|---|---|---|---|---|---|---|---|---|---|---|---|---|---|---|---|---|---|---|---|---|---|---|---|---|---|---|---|---|---|---|---|---|---|---|---|---|---|---|---|---|---|---|---|---|---|---|---|---|---|---|---|---|---|---|---|---|---|---|---|---|---|---|---|---|---|---|---|---|---|---|---|---|---|---|---|---|---|---|---|---|---|---|---|
| 2017 | 15 | 4 | 15 | 3 | 13 | +3 | |||||||||||||||||||||||||||||||||||||||||||||||||||||||||||||||||||||||||||||||||||||||||||||
| 2016 | 13 | 1 | 15 | 7 | 14 | -7 | |||||||||||||||||||||||||||||||||||||||||||||||||||||||||||||||||||||||||||||||||||||||||||||
| 2015 | 11 | 3 | 16 | 8 | 12 | -6 | |||||||||||||||||||||||||||||||||||||||||||||||||||||||||||||||||||||||||||||||||||||||||||||
| 2014 | 11 | 6 | 18 | 5 | 10 | +2 | |||||||||||||||||||||||||||||||||||||||||||||||||||||||||||||||||||||||||||||||||||||||||||||
| 2013 | 12 | 5 | 19 | 2 | 12 | +3 | |||||||||||||||||||||||||||||||||||||||||||||||||||||||||||||||||||||||||||||||||||||||||||||
| 2012 | 13 | 6 | 19 | 3 | 9 | +7 | |||||||||||||||||||||||||||||||||||||||||||||||||||||||||||||||||||||||||||||||||||||||||||||
| 2011 | 11 | 7 | 15 | 7 | 10 | +1 | |||||||||||||||||||||||||||||||||||||||||||||||||||||||||||||||||||||||||||||||||||||||||||||
| 2010 | 13 | 9 | 18 | 5 | 5 | +12 | |||||||||||||||||||||||||||||||||||||||||||||||||||||||||||||||||||||||||||||||||||||||||||||
| 2009 | 23 | 10 | 12 | 1 | 4 | +28 | |||||||||||||||||||||||||||||||||||||||||||||||||||||||||||||||||||||||||||||||||||||||||||||
| 2008 | 29 | 6 | 10 | 1 | 4 | +30 | |||||||||||||||||||||||||||||||||||||||||||||||||||||||||||||||||||||||||||||||||||||||||||||
| Solid states are those in which a party has a 10-point or greater advantage; Leaning states are those in which a party has an advantage of more than five points but less than 10 points. Competitive states are those in which the party advantage is five points or less. | |||||||||||||||||||||||||||||||||||||||||||||||||||||||||||||||||||||||||||||||||||||||||||||||||||
| Gallup | |||||||||||||||||||||||||||||||||||||||||||||||||||||||||||||||||||||||||||||||||||||||||||||||||||
The remaining 15 states are considered competitive, which Gallup defines as a difference between Republicans and Democrats of five percentage points or less. Leaning states have a greater than five-point but less than 10-point advantage for either party, while solid states are those in which a party has a 10-point or greater advantage.
The results are based on aggregated data from Gallup tracking throughout 2017. Gallup asked a total of 180,106 U.S. adults for their party identification and, if they said they were independent, probed their party leaning. Those interviews were conducted with at least 493 adults in every state, and 1,000 or more residents in 40 of the states. Each sample of state residents was weighted to ensure it is demographically representative of the state's adult population.
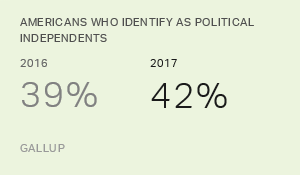
View Gallup's compilation of party identification and independents' party leanings for each state. Allocating leaners to the party groups gives a better indication of a party's electoral strength in a state than basic party identification does, because there is wide variation by state in the percentage who identify as political independents. Some states -- like Massachusetts, Rhode Island and Alaska -- have a majority of residents identifying as political independents but tend to be dominated by one party in elections.
Five states shifted from a Republican status to a competitive one between 2016 and 2017: Indiana, Iowa, Kentucky, Ohio and West Virginia. Five other states moved from a competitive status to a Democratic one: Colorado, Maine, Michigan, Minnesota and Virginia. No states moved from competitive to Republican, or from Democratic to competitive. Comparing 2008, the first year of Gallup tracking, with 2016, all state shifts had been in the Republican direction.
The 2017 political map, thus, most closely resembles those seen in 2011 through 2014, the middle years of Barack Obama's presidency. In the last year of George W. Bush's presidency and first two years of Obama's, the states (and the nation) were decidedly Democratic. In Obama's last two years in office -- including 2016, when Donald Trump was elected as his successor -- more states had a Republican rather than a Democratic allegiance.
Massachusetts Most Democratic State; Wyoming, North Dakota Most Republican
Democratic identifiers and leaners outnumbered Republicans and Republican leaners by 31 percentage points in Massachusetts, the largest party advantage in any state. Maryland was second, followed by New York, Vermont, Hawaii, California and Rhode Island, all with Democratic advantages of 20 points or greater.
| Democratic/Lean Democratic | Republican/Lean Republican | Democratic advantage | |||||||||||||||||||||||||||||||||||||||||||||||||||||||||||||||||||||||||||||||||||||||||||||||||
|---|---|---|---|---|---|---|---|---|---|---|---|---|---|---|---|---|---|---|---|---|---|---|---|---|---|---|---|---|---|---|---|---|---|---|---|---|---|---|---|---|---|---|---|---|---|---|---|---|---|---|---|---|---|---|---|---|---|---|---|---|---|---|---|---|---|---|---|---|---|---|---|---|---|---|---|---|---|---|---|---|---|---|---|---|---|---|---|---|---|---|---|---|---|---|---|---|---|---|---|
| % | % | pct. pts. | |||||||||||||||||||||||||||||||||||||||||||||||||||||||||||||||||||||||||||||||||||||||||||||||||
| Massachusetts | 57 | 26 | 31 | ||||||||||||||||||||||||||||||||||||||||||||||||||||||||||||||||||||||||||||||||||||||||||||||||
| Maryland | 56 | 28 | 28 | ||||||||||||||||||||||||||||||||||||||||||||||||||||||||||||||||||||||||||||||||||||||||||||||||
| New York | 52 | 29 | 23 | ||||||||||||||||||||||||||||||||||||||||||||||||||||||||||||||||||||||||||||||||||||||||||||||||
| Vermont | 52 | 30 | 22 | ||||||||||||||||||||||||||||||||||||||||||||||||||||||||||||||||||||||||||||||||||||||||||||||||
| Hawaii | 50 | 28 | 22 | ||||||||||||||||||||||||||||||||||||||||||||||||||||||||||||||||||||||||||||||||||||||||||||||||
| California | 51 | 30 | 21 | ||||||||||||||||||||||||||||||||||||||||||||||||||||||||||||||||||||||||||||||||||||||||||||||||
| Rhode Island | 48 | 27 | 21 | ||||||||||||||||||||||||||||||||||||||||||||||||||||||||||||||||||||||||||||||||||||||||||||||||
| Connecticut | 51 | 32 | 19 | ||||||||||||||||||||||||||||||||||||||||||||||||||||||||||||||||||||||||||||||||||||||||||||||||
| Illinois | 50 | 33 | 17 | ||||||||||||||||||||||||||||||||||||||||||||||||||||||||||||||||||||||||||||||||||||||||||||||||
| Washington | 49 | 34 | 15 | ||||||||||||||||||||||||||||||||||||||||||||||||||||||||||||||||||||||||||||||||||||||||||||||||
| New Jersey | 48 | 33 | 15 | ||||||||||||||||||||||||||||||||||||||||||||||||||||||||||||||||||||||||||||||||||||||||||||||||
| Gallup | |||||||||||||||||||||||||||||||||||||||||||||||||||||||||||||||||||||||||||||||||||||||||||||||||||
Massachusetts has ranked among the five most Democratic states in each of the 10 years Gallup has reported state-level party identification, also finishing first in 2014. The 10 most Democratic states have largely been consistent over time. Among 2017's top finishers, eight (all but Connecticut, and Washington and New Jersey, which tied for 10th) have been among the 10 most Democratic states every year since 2008.
Wyoming has been the first or second most Republican state every year since 2008, and essentially tied North Dakota for first in 2017. Three other states -- Utah, Idaho and Alaska -- also had more than 20-point Republican advantages in state partisanship.
| Republican/Lean Republican | Democratic/Lean Democratic | Republican advantage | |||||||||||||||||||||||||||||||||||||||||||||||||||||||||||||||||||||||||||||||||||||||||||||||||
|---|---|---|---|---|---|---|---|---|---|---|---|---|---|---|---|---|---|---|---|---|---|---|---|---|---|---|---|---|---|---|---|---|---|---|---|---|---|---|---|---|---|---|---|---|---|---|---|---|---|---|---|---|---|---|---|---|---|---|---|---|---|---|---|---|---|---|---|---|---|---|---|---|---|---|---|---|---|---|---|---|---|---|---|---|---|---|---|---|---|---|---|---|---|---|---|---|---|---|---|
| % | % | pct. pts. | |||||||||||||||||||||||||||||||||||||||||||||||||||||||||||||||||||||||||||||||||||||||||||||||||
| Wyoming | 56 | 27 | 29 | ||||||||||||||||||||||||||||||||||||||||||||||||||||||||||||||||||||||||||||||||||||||||||||||||
| North Dakota | 56 | 28 | 28 | ||||||||||||||||||||||||||||||||||||||||||||||||||||||||||||||||||||||||||||||||||||||||||||||||
| Utah | 56 | 29 | 27 | ||||||||||||||||||||||||||||||||||||||||||||||||||||||||||||||||||||||||||||||||||||||||||||||||
| Idaho | 53 | 31 | 22 | ||||||||||||||||||||||||||||||||||||||||||||||||||||||||||||||||||||||||||||||||||||||||||||||||
| Alaska | 52 | 31 | 21 | ||||||||||||||||||||||||||||||||||||||||||||||||||||||||||||||||||||||||||||||||||||||||||||||||
| South Dakota | 52 | 35 | 17 | ||||||||||||||||||||||||||||||||||||||||||||||||||||||||||||||||||||||||||||||||||||||||||||||||
| Nebraska | 50 | 35 | 15 | ||||||||||||||||||||||||||||||||||||||||||||||||||||||||||||||||||||||||||||||||||||||||||||||||
| Alabama | 50 | 35 | 15 | ||||||||||||||||||||||||||||||||||||||||||||||||||||||||||||||||||||||||||||||||||||||||||||||||
| Kansas | 48 | 34 | 14 | ||||||||||||||||||||||||||||||||||||||||||||||||||||||||||||||||||||||||||||||||||||||||||||||||
| Oklahoma | 49 | 35 | 14 | ||||||||||||||||||||||||||||||||||||||||||||||||||||||||||||||||||||||||||||||||||||||||||||||||
| Montana | 51 | 37 | 14 | ||||||||||||||||||||||||||||||||||||||||||||||||||||||||||||||||||||||||||||||||||||||||||||||||
| Gallup | |||||||||||||||||||||||||||||||||||||||||||||||||||||||||||||||||||||||||||||||||||||||||||||||||||
Along with Wyoming, Utah and Idaho have also consistently ranked among the most Republican states, finishing in the top four every year. Those states, along with Kansas, are the only ones to rank in the top 10 every year since 2008. North Dakota has ranked among the 10 most Republican states most years, but was on the edge of the top 10 in 2009 and 2010.
There were 15 competitive states in 2017: Arizona, Florida, Georgia, Indiana, Iowa, Kentucky, Louisiana, Nevada, New Hampshire, North Carolina, Ohio, Pennsylvania, Texas, West Virginia and Wisconsin.
Of these, only two -- Georgia and Arizona -- have been rated as competitive every year since 2008. Wisconsin, Nevada and Florida have been competitive each of the past eight years, North Carolina the past seven years, and Louisiana the past six.
Implications
Democrats regained momentum at the state level in 2017, with 10 states showing enough of a shift in residents' party affiliation to change from a Republican state to a competitive one, or from competitive to Democratic. The 2017 shift was manifested in major Democratic victories in statewide elections in Virginia and Alabama, as well as close losses in congressional districts in Kansas, Montana and Georgia that had traditionally backed Republican candidates.
Democratic gains are likely a reaction to Trump and his relative unpopularity, with approval ratings consistently below 40%. Obama was more popular while president, with approval ratings largely in the 40s, but there was still movement away from his party at the state level, suggesting a potential political downside for the party occupying the White House.
If these recent trends continue, 2018 could be another good year for Democrats, as they look to weaken the Republican majority in Congress if not displace it. And if, as occurred under Obama, the states continue to move away from the president's party during his time in office, the Democrats may be in a strong position heading into the 2020 presidential election.
Editor's Note: The first table in this story has been updated to show the political composition of the 50 U.S. states from 2008 to 2017. An earlier version of the story incorrectly showed the 2017 party distribution in each state.
Survey Methods
Results for this Gallup poll are based on telephone interviews conducted in 2017, on the Gallup U.S. Daily survey, with a random sample of 180,106 adults, aged 18 and older, living in all 50 U.S. states and the District of Columbia.
Margins of error for individual states are no greater than ±6 percentage points and are ±3 percentage points in most states. All reported margins of sampling error include computed design effects for weighting.
Each sample of national adults includes a minimum quota of 70% cellphone respondents and 30% landline respondents, with additional minimum quotas by time zone within region. Landline and cellular telephone numbers are selected using random-digit-dial methods.