Story Highlights
- Satisfaction with the size of the federal government falls to 34%
- Satisfaction with the U.S. system of government remains near historical low
- Democrats' satisfaction has fallen sharply compared with 2016
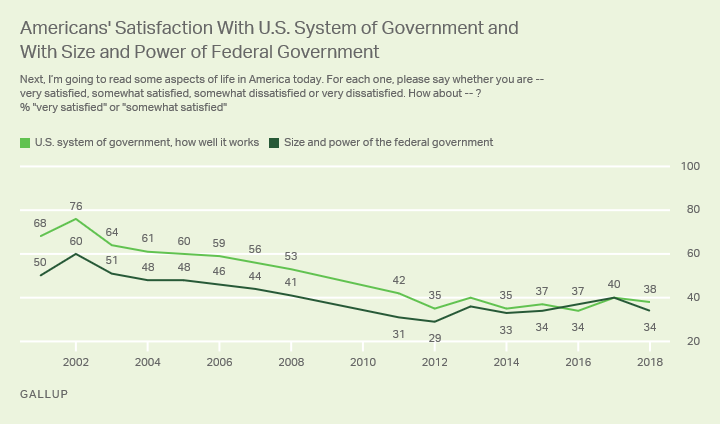
WASHINGTON, D.C. -- More than one year into Donald Trump's presidency, Americans' satisfaction with their national government shows no signs of improving. About a third of U.S. adults (34%) say they are "very" or "somewhat" satisfied with the size and power of the federal government, down six percentage points from 2017 but on par with most readings since 2011. Thirty-eight percent of Americans are satisfied with "our system of government and how well it works," essentially unchanged from 2017 and much lower than it was between 2001 and 2008.

Satisfaction with both the U.S. political system and the size and power of the federal government has remained at historically low levels since 2011. This period has been marked by widespread public disenchantment with the federal government.
Public satisfaction was notably higher from 2001-2007, particularly concerning the U.S. system of government and how well it works. In January 2001, only weeks after the Supreme Court effectively determined the outcome of the closest presidential election in the nation's history, 68% of U.S. adults said they were satisfied with their system of government. A slightly lower percentage of Americans, 50%, were satisfied with the size and power of the federal government at that time.
Both measures rose to record levels the next year as part of the post-9/11 "rally effect" -- 76% were satisfied with the system and 60% with the size and power of government. For both items, the satisfaction surge receded in 2003, and satisfaction began to trend downward. In the final two years of the Bush administration, both measures declined a bit further, with a then-low 53% of Americans saying they were satisfied with the U.S. system of government in 2008 and 41% saying they were satisfied with government size and power.
When Gallup again measured public views on these issues in 2011, satisfaction on both items had registered further double-digit declines. Since then, Americans' satisfaction with the U.S. system of government and with the size of the federal government has not been higher than 40%.
Democrats' Satisfaction With Size and System of Government Slumps
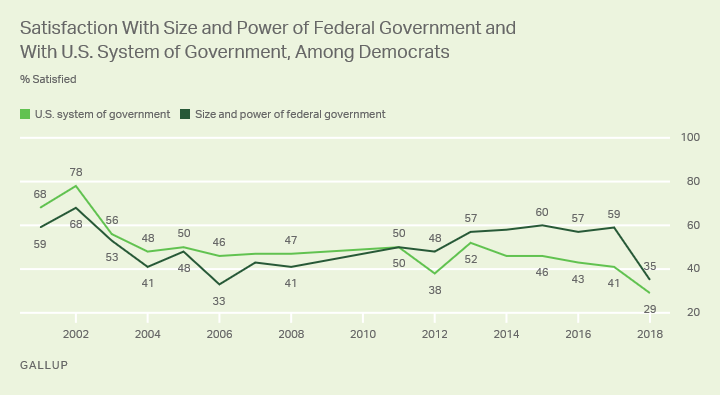
Among U.S. Democrats, satisfaction with the national government has tumbled considerably this year, and they are now less satisfied with the U.S. system of government than at any other time since 2001. A record-low 29% express support for the country's political system. Satisfaction with the size and power of the federal government, meanwhile, has fallen 24 points over the past year among Democrats.

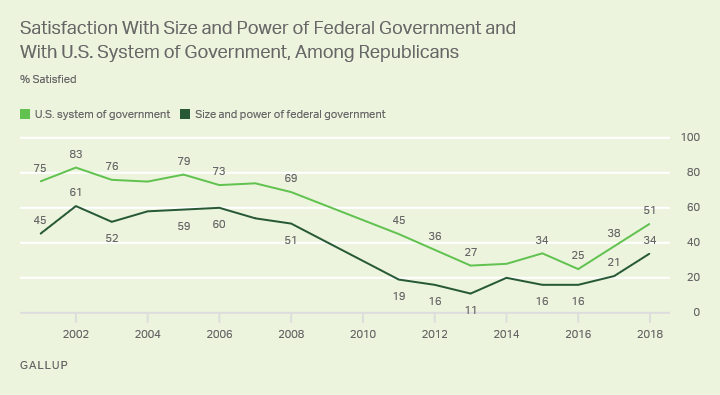
Republicans, meanwhile, have consistently been more likely to be satisfied with the U.S. system of government than with the size of the federal government, though their satisfaction has more than doubled on both items since 2016. A slim majority of Republicans, 51%, now say they are satisfied with their country's system of government, up from 38% in early January 2017 -- in the final days of the Barack Obama administration -- and 25% in 2016. Satisfaction with the size of government rose to 34% among Republicans this year, up from 21% in 2017 and 16% in 2016.

Bottom Line
Even as the Trump administration dramatically revamps the U.S. federal government by eliminating government regulations, reducing the civilian workforce and more generally emphasizing priorities that differ from those favored by Trump's predecessor, Americans' satisfaction with two aspects of their national government -- the size and power of the federal government and the U.S. system of government and how well it works -- remains low. This outcome is partially attributable to Americans' increasing political polarization, a phenomenon in which most adherents of the party not holding the presidency are likely to offer negative feedback on most political or policy-related issues, such as these two items.
Beyond polarization, there are reasons to believe that a significant share of the country will continue to be dissatisfied with the size and power of the federal government and the U.S. system of government for the foreseeable future.
Republicans had held increasingly skeptical views of the federal government during the 2000s, and those views changed little during the Obama administration. So it is unclear whether Republican control of Congress and the presidency can substantially reverse these attitudes. Notably, just over a third of Republicans (34%) are satisfied with the size and power of the federal government -- admittedly more than twice as high as where it stood in 2016, but still more than 20 points below GOP satisfaction on this item the last time Republicans enjoyed a similar level of political dominance (2006). Along the same lines, a Gallup poll in late 2017 found two-thirds of Republicans believe the federal government has too much power, though this figure had fallen from 2016.
For Democrats, before this year's sharp decline in satisfaction with the U.S. system of government, satisfaction had been below majority levels since 2004, even though the party occupied the White House for most of this time. Indeed, satisfaction among Democrats was about as high during Obama's second term as it was in Bush's final term. The source of Democratic discontent here is less clear than the source of Republican discontent. But other Gallup research shows majorities of Democrats since the 2000s have supported changing key aspects of the U.S. political system, notably the Electoral College, which played a role in the election losses of two of the past five Democratic presidential candidates.
Survey Methods
Results for this Gallup poll are based on telephone interviews conducted Jan. 2-7, 2018, on the Gallup U.S. Poll, with a random sample of 1,024 adults, aged 18 and older, living in all 50 U.S. states and the District of Columbia. For results based on the total sample of national adults, the margin of sampling error is ±3 percentage points at the 95% confidence level.
Each sample of national adults includes a minimum quota of 70% cellphone respondents and 30% landline respondents, with additional minimum quotas by time zone within region. Landline and cellular telephone numbers are selected using random-digit-dial methods.
Learn more about how the Gallup Poll Social Series works.


