Story Highlights
- Naples-Immokalee-Marco Island at or near top of list across all well-being elements
- Fort Smith, Arkansas-Oklahoma, residents had the lowest well-being
- Boulder, Colorado, leads nation in physical well-being
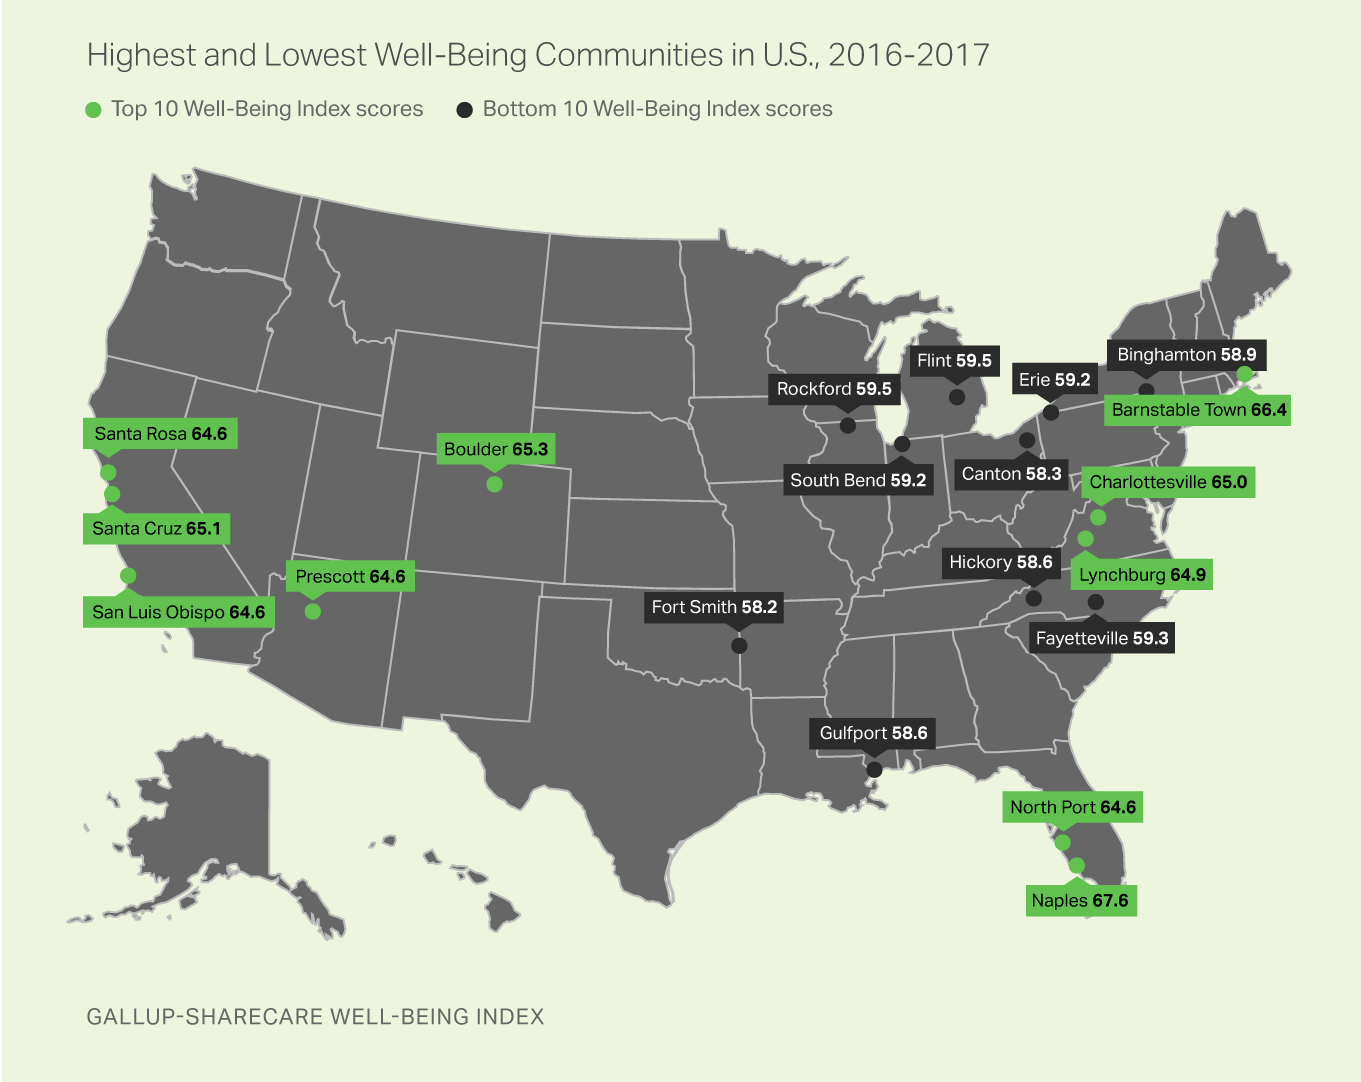
WASHINGTON, D.C. -- For the third straight year, the Naples-Immokalee-Marco Island, Florida, metro area has the highest well-being across 186 U.S. communities, based on data collected in 2016 and 2017 as part of the Gallup-Sharecare Well-Being Index. Barnstable Town, Massachusetts; Boulder, Colorado; Santa Cruz-Watsonville, California; and Charlottesville, Virginia, round out the top five metro areas.
| Well-Being Index score | |||||||||||||||||||||||||||||||||||||||||||||||||||||||||||||||||||||||||||||||||||||||||||||||||||
|---|---|---|---|---|---|---|---|---|---|---|---|---|---|---|---|---|---|---|---|---|---|---|---|---|---|---|---|---|---|---|---|---|---|---|---|---|---|---|---|---|---|---|---|---|---|---|---|---|---|---|---|---|---|---|---|---|---|---|---|---|---|---|---|---|---|---|---|---|---|---|---|---|---|---|---|---|---|---|---|---|---|---|---|---|---|---|---|---|---|---|---|---|---|---|---|---|---|---|---|
| Naples-Immokalee-Marco Island, FL | 67.6 | ||||||||||||||||||||||||||||||||||||||||||||||||||||||||||||||||||||||||||||||||||||||||||||||||||
| Barnstable Town, MA | 66.4 | ||||||||||||||||||||||||||||||||||||||||||||||||||||||||||||||||||||||||||||||||||||||||||||||||||
| Boulder, CO | 65.3 | ||||||||||||||||||||||||||||||||||||||||||||||||||||||||||||||||||||||||||||||||||||||||||||||||||
| Santa Cruz-Watsonville, CA | 65.1 | ||||||||||||||||||||||||||||||||||||||||||||||||||||||||||||||||||||||||||||||||||||||||||||||||||
| Charlottesville, VA | 65.0 | ||||||||||||||||||||||||||||||||||||||||||||||||||||||||||||||||||||||||||||||||||||||||||||||||||
| Lynchburg, VA | 64.9 | ||||||||||||||||||||||||||||||||||||||||||||||||||||||||||||||||||||||||||||||||||||||||||||||||||
| North Port-Sarasota-Bradenton, FL | 64.6 | ||||||||||||||||||||||||||||||||||||||||||||||||||||||||||||||||||||||||||||||||||||||||||||||||||
| Santa Rosa, CA | 64.6 | ||||||||||||||||||||||||||||||||||||||||||||||||||||||||||||||||||||||||||||||||||||||||||||||||||
| Prescott, AZ | 64.6 | ||||||||||||||||||||||||||||||||||||||||||||||||||||||||||||||||||||||||||||||||||||||||||||||||||
| San Luis Obispo-Paso Robles-Arroyo Grande, CA | 64.6 | ||||||||||||||||||||||||||||||||||||||||||||||||||||||||||||||||||||||||||||||||||||||||||||||||||
| Santa Maria-Santa Barbara, CA | 64.5 | ||||||||||||||||||||||||||||||||||||||||||||||||||||||||||||||||||||||||||||||||||||||||||||||||||
| Ann Arbor, MI | 64.4 | ||||||||||||||||||||||||||||||||||||||||||||||||||||||||||||||||||||||||||||||||||||||||||||||||||
| Salinas, CA | 64.2 | ||||||||||||||||||||||||||||||||||||||||||||||||||||||||||||||||||||||||||||||||||||||||||||||||||
| Fort Collins, CO | 64.0 | ||||||||||||||||||||||||||||||||||||||||||||||||||||||||||||||||||||||||||||||||||||||||||||||||||
| El Paso, TX | 64.0 | ||||||||||||||||||||||||||||||||||||||||||||||||||||||||||||||||||||||||||||||||||||||||||||||||||
| Portland-South Portland, ME | 63.9 | ||||||||||||||||||||||||||||||||||||||||||||||||||||||||||||||||||||||||||||||||||||||||||||||||||
| Lancaster, PA | 63.9 | ||||||||||||||||||||||||||||||||||||||||||||||||||||||||||||||||||||||||||||||||||||||||||||||||||
| Urban Honolulu, HI | 63.9 | ||||||||||||||||||||||||||||||||||||||||||||||||||||||||||||||||||||||||||||||||||||||||||||||||||
| Asheville, NC | 63.8 | ||||||||||||||||||||||||||||||||||||||||||||||||||||||||||||||||||||||||||||||||||||||||||||||||||
| San Diego-Carlsbad, CA | 63.8 | ||||||||||||||||||||||||||||||||||||||||||||||||||||||||||||||||||||||||||||||||||||||||||||||||||
| Gallup-Sharecare Well-Being Index | |||||||||||||||||||||||||||||||||||||||||||||||||||||||||||||||||||||||||||||||||||||||||||||||||||
After having the seventh-highest well-being community in 2012-2013, the Naples area ascended to the top spot in 2014-2015 and has since remained there. This marks the first time in 10 years of annual Well-Being Index reporting that the same community has topped the rankings three times in a row.
The Gallup-Sharecare Well-Being Index is calculated on a scale of 0 to 100, where 0 represents the lowest possible well-being and 100 represents the highest possible well-being. The Well-Being Index score for the U.S. and for each community is made up of metrics within each of the five essential elements of well-being:
- Purpose: liking what you do each day and being motivated to achieve your goals
- Social: having supportive relationships and love in your life
- Financial: managing your economic life to reduce stress and increase security
- Community: liking where you live, feeling safe and having pride in your community
- Physical: having good health and enough energy to get things done daily
In most cases, a difference of 1.0 to 2.0 points in the Well-Being Index score of any two communities represents a statistically significant gap and is characterized by meaningfully large differences in at least some of the individual metrics that make up the Gallup-Sharecare Well-Being Index.
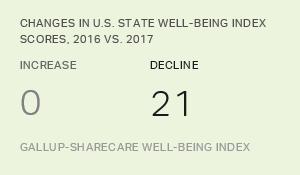
The Well-Being Index score for the Naples metro area has climbed to 67.6 for 2016-2017 from 66.3 in 2015-2016. This uptick has come amid a significant decline in well-being nationally.
Gallup tracks well-being in metro areas using two-year rolling averages, allowing for larger sample sizes that improve the statistical accuracy of the data and allow more communities to be reported each year. The two-year rolling measurement periods for communities mean that data from interviews conducted during 2016 are included in both the 2015-2016 report and the 2016-2017 report.
Each of the top five communities for 2016-2017 have frequented the list of the top 10 well-being communities numerous times in prior years. Other top communities that typically have ranked among the highest for well-being since 2008 include Lynchburg, Virginia; North Port-Sarasota-Bradenton, Florida; the San Luis Obispo, California, metro; Lancaster, Pennsylvania; Fort Collins, Colorado; and Urban Honolulu, Hawaii.
Prescott, Arizona, broke into the highest 10 list for the first time this cycle after finishing 13th in 2015-2016.
Fort Smith Again Has Lowest Well-Being in U.S.
Fort Smith, Arkansas-Oklahoma, had the lowest overall well-being of the 186 communities, making this the third straight time that Fort Smith was among the two lowest communities for well-being. As with the top communities, most of the lowest well-being communities in 2016-2017 have consistently been near the bottom of the list since 2008, including Canton-Massillon, Ohio; Hickory-Lenoir-Morganton, North Carolina; Gulfport-Biloxi-Pascagoula, Mississippi; and Flint, Michigan. The South Bend, Indiana-Michigan, community slipped into the lowest 10 this year for the first time.
| Well-Being Index score | |||||||||||||||||||||||||||||||||||||||||||||||||||||||||||||||||||||||||||||||||||||||||||||||||||
|---|---|---|---|---|---|---|---|---|---|---|---|---|---|---|---|---|---|---|---|---|---|---|---|---|---|---|---|---|---|---|---|---|---|---|---|---|---|---|---|---|---|---|---|---|---|---|---|---|---|---|---|---|---|---|---|---|---|---|---|---|---|---|---|---|---|---|---|---|---|---|---|---|---|---|---|---|---|---|---|---|---|---|---|---|---|---|---|---|---|---|---|---|---|---|---|---|---|---|---|
| Fort Smith, AR-OK | 58.2 | ||||||||||||||||||||||||||||||||||||||||||||||||||||||||||||||||||||||||||||||||||||||||||||||||||
| Canton-Massillon, OH | 58.3 | ||||||||||||||||||||||||||||||||||||||||||||||||||||||||||||||||||||||||||||||||||||||||||||||||||
| Gulfport-Biloxi-Pascagoula, MS | 58.6 | ||||||||||||||||||||||||||||||||||||||||||||||||||||||||||||||||||||||||||||||||||||||||||||||||||
| Hickory-Lenoir-Morganton, NC | 58.6 | ||||||||||||||||||||||||||||||||||||||||||||||||||||||||||||||||||||||||||||||||||||||||||||||||||
| Binghamton, NY | 58.9 | ||||||||||||||||||||||||||||||||||||||||||||||||||||||||||||||||||||||||||||||||||||||||||||||||||
| South Bend-Mishawaka, IN-MI | 59.2 | ||||||||||||||||||||||||||||||||||||||||||||||||||||||||||||||||||||||||||||||||||||||||||||||||||
| Erie, PA | 59.2 | ||||||||||||||||||||||||||||||||||||||||||||||||||||||||||||||||||||||||||||||||||||||||||||||||||
| Fayetteville, NC | 59.3 | ||||||||||||||||||||||||||||||||||||||||||||||||||||||||||||||||||||||||||||||||||||||||||||||||||
| Rockford, IL | 59.5 | ||||||||||||||||||||||||||||||||||||||||||||||||||||||||||||||||||||||||||||||||||||||||||||||||||
| Flint, MI | 59.5 | ||||||||||||||||||||||||||||||||||||||||||||||||||||||||||||||||||||||||||||||||||||||||||||||||||
| Gallup-Sharecare Well-Being Index | |||||||||||||||||||||||||||||||||||||||||||||||||||||||||||||||||||||||||||||||||||||||||||||||||||
Highest, Lowest Communities Reflect State Well-Being Patterns
Nationally, the U.S. map of highest and lowest well-being communities generally reflects the pattern found across states, with the lowest well-being metro areas found primarily in the South and then winding north up through the industrial Midwest. The highest well-being metro areas are scattered across the Eastern Seaboard as well as the Mountain West and West.
Naples Metro Area Among Nation's Best in All Five Elements
The Naples metro area was among the top two communities in the U.S. across all five elements of well-being, the first time that a single community has shown such broad-based well-being.
Highlights for top-ranking communities in other areas of well-being in 2016-2017 include:
- Boulder, a longtime pacesetter nationally in physical well-being, was the top U.S. community on this element. The state of California had three of the next four highest-rated metro areas in the physical element: Santa Cruz, Santa Rosa and Santa Barbara.
- Texas leads the nation in purpose well-being with two communities in the top five for the element -- McAllen and El Paso -- mirroring 2015-2016 results. Naples; Lynchburg, Virginia; and Salinas, California, were other top communities for purpose well-being.
- Barnstable Town residents have the second-highest social well-being after Naples area residents but edge out Naples for the top spot for community well-being, followed by the San Luis Obispo metro area and Prescott, Arizona.
- After Naples, the top metro areas in financial well-being are Barnstable Town, North Port-Sarasota-Bradenton, Florida; Ann Arbor, Michigan; and Charlottesville, Virginia.
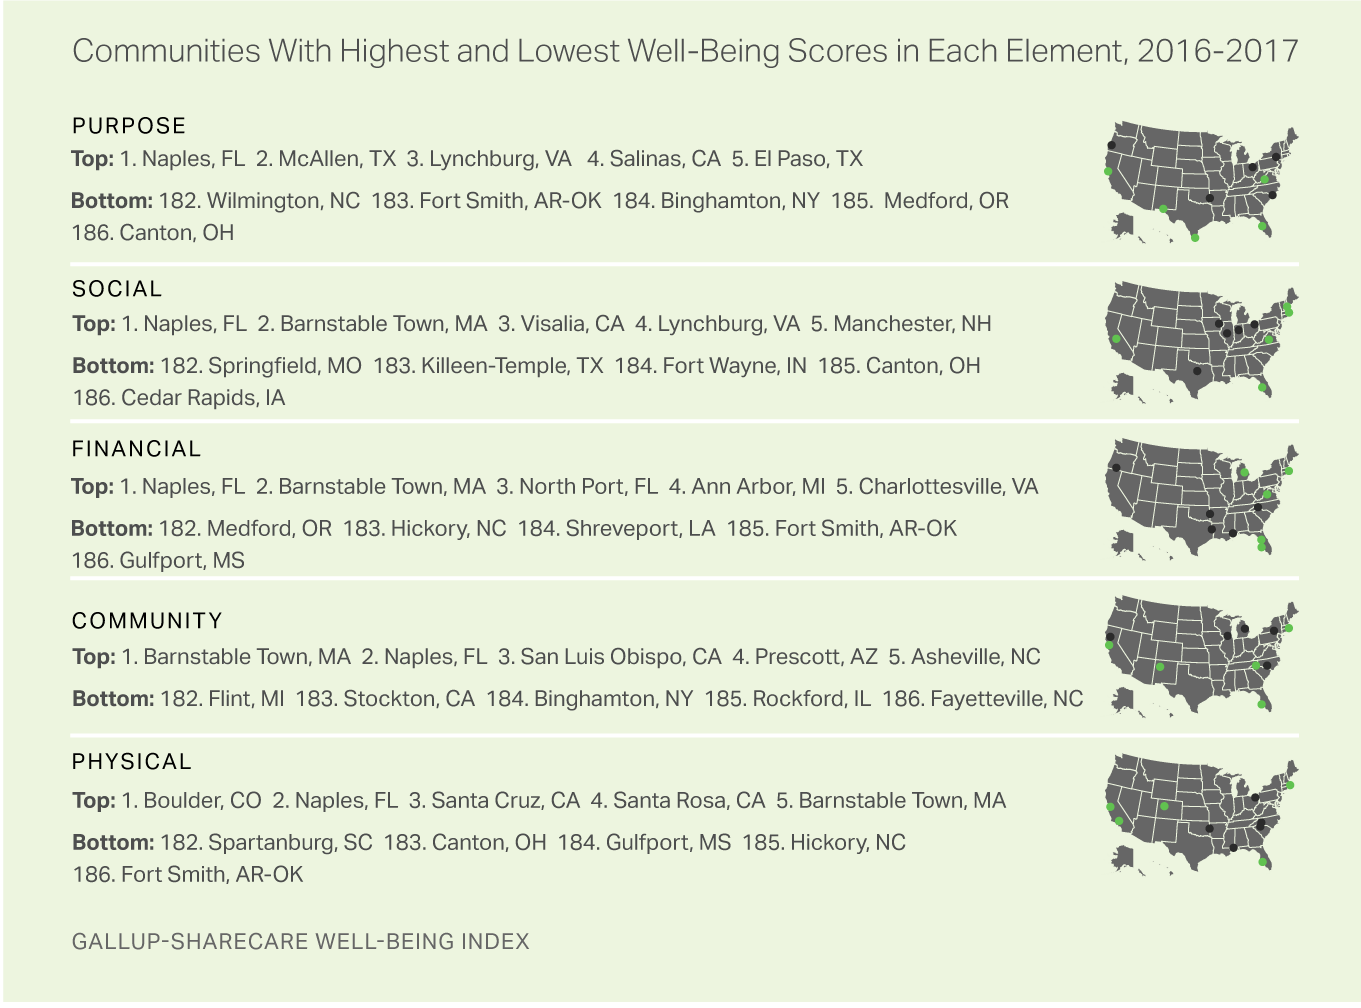
Residents of Fort Smith were among the five lowest-ranked communities in four of the five elements: purpose, social, financial and physical. Similarly, Canton-Massillon residents were among the bottom four nationally in purpose, social and physical well-being.
Poor performance in the community element of well-being was the most predictive indicator of low well-being generally, with six of the 10 lowest communities in the overall Well-Being Index also ranking among the lowest 10 for the community element. Fayetteville, North Carolina, and Rockford, Illinois, had the lowest well-being in the community element, while Flint, Michigan, remained among the lowest five nationally.
Implications
Some communities have managed to thrive in their well-being amid significant declines nationally. Chief among these is the Naples-Immokalee-Marco Island metro area, which has maintained the top spot three times in a row. Despite statistical declines in well-being across the state of Florida in 2017, Naples-Immokalee-Marco Island has seen its two-year Well-Being Index score improve, demonstrating that local efforts make it possible for communities to buck state and national trends.
The Naples metro area's well-being success may be in part because the area attracts individuals with high well-being to begin with. Older Americans -- who make up a larger percentage of the population in Naples than what is found nationally -- have widely better well-being than their younger counterparts.
But Naples has not always been a top well-being community. As recently as 2011, this area had the 73rd-highest well-being out of 190 communities reported nationally. At least some of the improvement seen in recent years may have been driven by the Blue Zones Project in the Naples area. This program, which seeks to make healthy choices easier for residents to make, has been used in the area since 2015.
The Naples area's success adds to other evidence demonstrating that having high well-being across all five elements yields better outcomes than physical wellness alone. Naples' nearly clean sweep across the five elements shows that efforts to enhance all aspects of residents' well-being can pay off. Naples can serve as a blueprint for lasting well-being success, and community leaders across the nation can follow this blueprint and adapt it to meet the needs of their areas' own residents.
View the complete results in Sharecare's report, State of American Well-Being: 2017 Community Well-Being Rankings.
Survey Methods
Results are based a subset of 337,690 telephone interviews with U.S. adults across all 50 states and the District of Columbia, conducted from Jan. 2, 2016-Dec. 30, 2017. In 2016, 177,192 interviews were conducted nationally; in 2017, 160,498 interviews were conducted. Gallup conducts 500 telephone interviews daily, resulting in a sample that projects to an estimated 95% of all U.S. adults. Metropolitan Statistical Areas (MSAs) are based on U.S. Office of Management and Budget definitions. Only MSAs with at least 300 completed interviews are reported, and results for each MSA are uniquely weighted according to Nielsen Claritas demographic targets.
The Well-Being Index margin of sampling error for the reported communities will range from about ±1.7 points for the least populated to about ±0.3 points for the most heavily populated. All reported margins of sampling error include computed design effects due to weighting.
Each daily sample of national adults for data collected in 2016 comprises 60% cellphone respondents and 40% landline respondents. Each daily sample in 2017 comprises 70% cellphone and 30% landline. Additional minimum quotas by time zone and within region are included in the sampling approach.
Learn more about how the Gallup-Sharecare Well-Being Index works.