Story Highlights
- Migrants in the least-accepting countries rate their lives worse
- Migrants' lives in least-accepting countries worsen the longer they stay
- In most-accepting countries, migrants rate their lives higher
WASHINGTON, D.C. -- A new Gallup analysis released Wednesday in the 2018 World Happiness Report details how people's acceptance of migrants -- or the lack thereof -- is linked to how migrants themselves see their own lives. The findings show that migrants living in countries scoring lowest on Gallup's Migrant Acceptance Index evaluate their lives less positively than those who live in countries that are the most accepting of migrants.
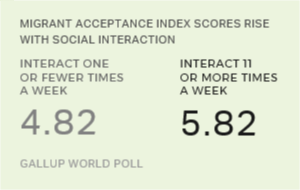
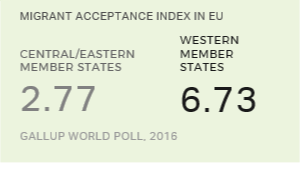
Gallup created the Migrant Acceptance Index to gauge people's acceptance of migrants based on increasing degrees of personal proximity. The index is based on three questions Gallup asked in 138 countries in 2016 and in the U.S. and Canada in 2017. The questions ask whether people think immigrants living in their country, becoming their neighbors and marrying into their families are good things or bad things. The higher the score, the more accepting the population is of migrants.
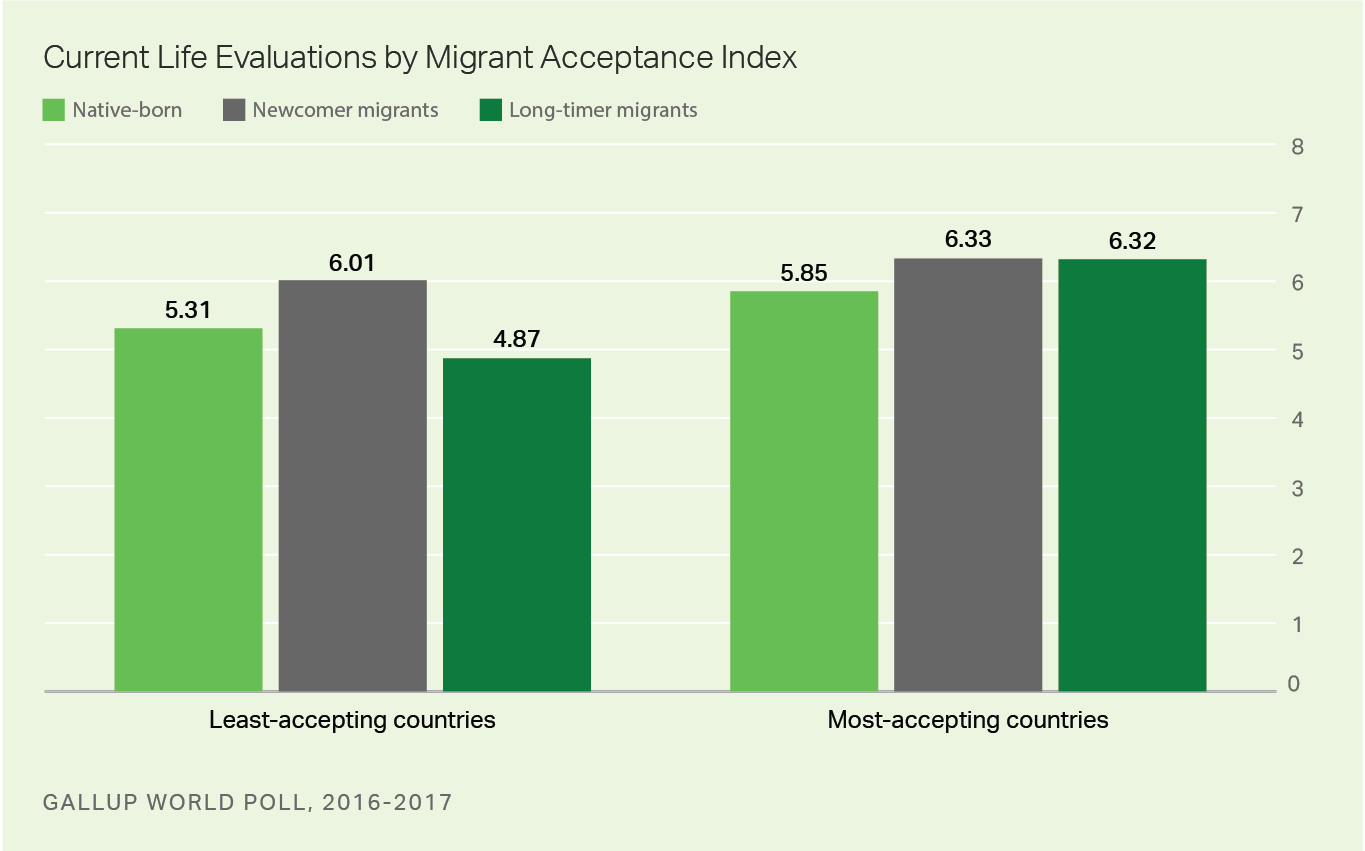
In the least-accepting countries, migrants who have been in their new countries for less than five years -- newcomers -- rate their current lives more positively than the native-born. But this positivity fades the longer migrants stay in countries where the population is not receptive to them. The life evaluations of those who have been in the country five years or more -- long-timers -- are statistically much lower than the scores for newcomers, but their life evaluations also drop lower than the scores for the native-born.
The story is different for migrants in the most-accepting countries. Newcomer migrants and long-timer migrants both rate their lives higher than the native-born do. Notably, migrants do not lose their positive outlook the longer they stay: The life evaluations of newcomers and long-timers are statistically the same.
Outlook for the Future
Migrants and the native-born in the least-accepting countries rate their future lives in five years better than their present situations, but they still lag far behind their counterparts in the most-accepting countries. Newcomers in the least-accepting countries have a more positive outlook for their lives than the native-born do, but long-timers again are more pessimistic than either group.
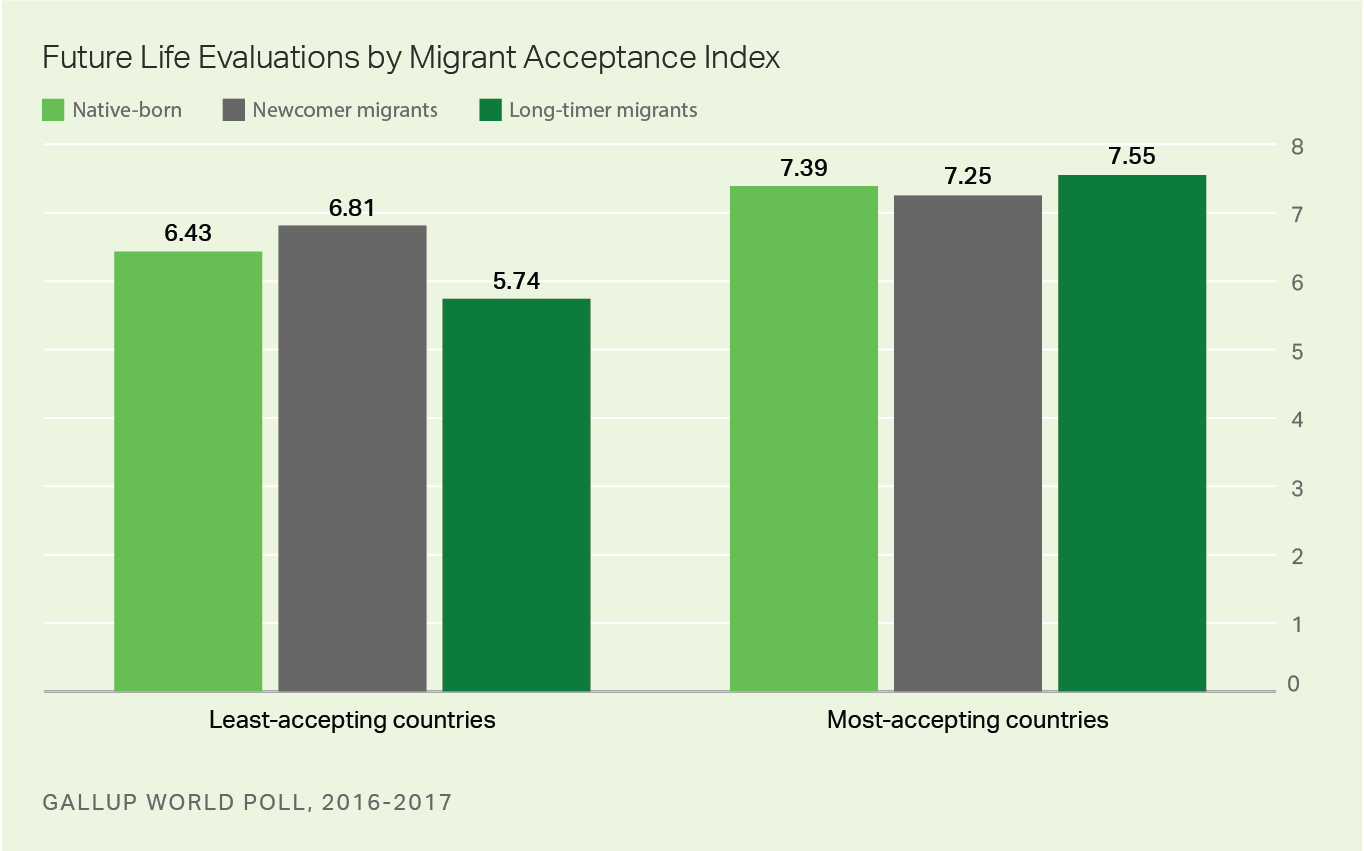
In the most-accepting countries, the native-born and newcomer migrants share the same level of optimism about their lives in five years, but long-timers give their future lives higher ratings than the native-born or newcomers do. It's possible that because long-timers have had more time than newcomers to establish themselves in their lives and careers, they not only may be more hopeful but also more confident about what the future may bring.
Future Research
Previous Gallup research on migrants indicates that where people come from, where they move to and how long they stay play a role in whether they gain or lose from migration. Future World Poll research on migrant acceptance may allow us not only to do more in-depth analysis at the country level, but also to discover whether migrants' countries of origin also factor into their life evaluations when they move to countries that are more likely to accept or not to accept them. Further, we would be able to investigate how migrant acceptance may affect potential migrants' desire to migrate, their plans to move and where they would like to go.
Dr. Anita Pugliese contributed to this analysis.
Parts of this article are excerpted from the 2018 World Happiness Report.
Survey Methods
These results are based on telephone and face-to-face interviews with approximately 1,000 adults, aged 15 and older, conducted in 138 countries throughout 2016 and in the U.S. and Canada in 2017. In some countries, such as India, Russia and China, sample sizes are much larger -- between 2,000 and 4,000 adults. For results based on each total sample of national adults, the margin of sampling error ranges from ±2.1 percentage points to ±5.6 percentage points at the 95% confidence level. All reported margins of sampling error include computed design effects for weighting.
Learn more about how the Gallup World Poll works.
For more complete methodology and specific survey dates, please review Gallup's Country Data Set details.