Story Highlights
- 44% in U.K. approve of EU leadership, up from 37% pre-Brexit vote
- EU leadership approval up across most key demographic groups
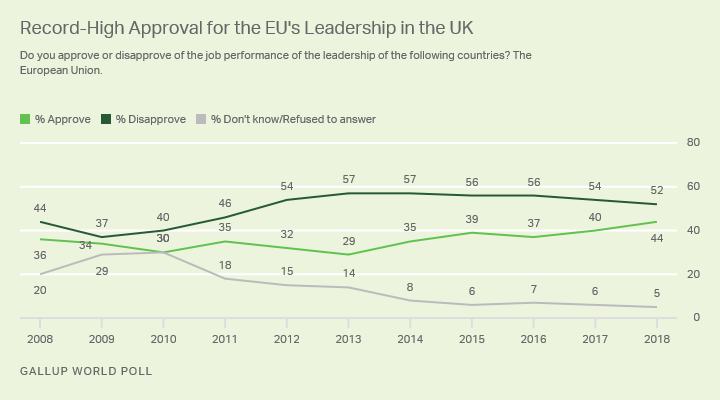
WASHINGTON, D.C. -- With the meeting to finalize and formalize the divorce between the United Kingdom and the European Union just days away, Britons' approval of the EU's leadership is at its highest point in a decade. Forty-four percent of Britons interviewed this summer -- perhaps the last time this will be measured before their country leaves the EU -- said they approve of the EU's leadership. This is up from 37% just before the Brexit vote in 2016.

These latest data come from Gallup's survey conducted June 21-July 21, amid ongoing negotiations to reach an agreement on the U.K.'s eventual exit from the EU in March 2019.
The 37% approval rating just before the Brexit vote in June 2016 was far from the record low of 29% in 2013, measured shortly after then-Prime Minister David Cameron promised a referendum on EU membership would take place. Cameron made this pledge in response to growing opposition to EU membership in his own Conservative Party at that time and had hoped to use the vote as an opportunity to negotiate a more favorable agreement for the U.K. with the union.
EU Leadership Approval Up Among Key Demographic Groups
Several demographic groups are behind this increase in approval -- many of them key segments of the "Remain" vote in 2016: young Britons, women and those with higher levels of education.
The biggest jump in the EU leadership's popularity has been among the youngest British adults. Approval among 15- to 29-year-olds has risen to 48%, up from 29% in 2016. However, the bloc's leadership is also far more popular now among the 30 to 49 age group, with 44% approving of the EU's leadership versus 31% in 2016.
| 2014 | 2015 | 2016 | 2017 | 2018 | ||||||||||||||||||||||||||||||||||||||||||||||||||||||||||||||||||||||||||||||||||||||||||||||||
|---|---|---|---|---|---|---|---|---|---|---|---|---|---|---|---|---|---|---|---|---|---|---|---|---|---|---|---|---|---|---|---|---|---|---|---|---|---|---|---|---|---|---|---|---|---|---|---|---|---|---|---|---|---|---|---|---|---|---|---|---|---|---|---|---|---|---|---|---|---|---|---|---|---|---|---|---|---|---|---|---|---|---|---|---|---|---|---|---|---|---|---|---|---|---|---|---|---|---|---|---|
| % | % | % | % | % | ||||||||||||||||||||||||||||||||||||||||||||||||||||||||||||||||||||||||||||||||||||||||||||||||
| Overall | 35 | 40 | 37 | 39 | 44 | |||||||||||||||||||||||||||||||||||||||||||||||||||||||||||||||||||||||||||||||||||||||||||||||
| Gender | ||||||||||||||||||||||||||||||||||||||||||||||||||||||||||||||||||||||||||||||||||||||||||||||||||||
| Male | 35 | 38 | 42 | 42 | 42 | |||||||||||||||||||||||||||||||||||||||||||||||||||||||||||||||||||||||||||||||||||||||||||||||
| Female | 34 | 40 | 33 | 39 | 46 | |||||||||||||||||||||||||||||||||||||||||||||||||||||||||||||||||||||||||||||||||||||||||||||||
| Age | ||||||||||||||||||||||||||||||||||||||||||||||||||||||||||||||||||||||||||||||||||||||||||||||||||||
| 15-29 | 45 | 41 | 29 | 41 | 48 | |||||||||||||||||||||||||||||||||||||||||||||||||||||||||||||||||||||||||||||||||||||||||||||||
| 30-49 | 33 | 38 | 31 | 43 | 44 | |||||||||||||||||||||||||||||||||||||||||||||||||||||||||||||||||||||||||||||||||||||||||||||||
| 50+ | 31 | 38 | 46 | 38 | 41 | |||||||||||||||||||||||||||||||||||||||||||||||||||||||||||||||||||||||||||||||||||||||||||||||
| Education | ||||||||||||||||||||||||||||||||||||||||||||||||||||||||||||||||||||||||||||||||||||||||||||||||||||
| Secondary education | 32 | 38 | 36 | 40 | 43 | |||||||||||||||||||||||||||||||||||||||||||||||||||||||||||||||||||||||||||||||||||||||||||||||
| College degree or more | 43 | 40 | 35 | 45 | 45 | |||||||||||||||||||||||||||||||||||||||||||||||||||||||||||||||||||||||||||||||||||||||||||||||
| * % Approve | ||||||||||||||||||||||||||||||||||||||||||||||||||||||||||||||||||||||||||||||||||||||||||||||||||||
| Gallup World Poll | ||||||||||||||||||||||||||||||||||||||||||||||||||||||||||||||||||||||||||||||||||||||||||||||||||||
Additionally, EU leadership approval among women has risen 13 percentage points since 2016 and now stands at 46%. There has also been a 10-point increase in approval among those in the U.K. with a college degree or higher.
Interestingly, one of the few groups among whom approval of EU leadership has not changed since the Brexit vote is men. EU leadership approval among men has held steady at 42% since before the referendum in 2016.
EU Leadership Approval Rises Even Among Potentially Disaffected Groups
The Brexit victory was cast as an effort by disaffected members of British society to shake up the system and reverse the decline in their own lives. And before the vote, approval ratings of EU leadership among several potentially disaffected groups were low. Since the referendum, however, approval ratings of EU leadership among some of these groups has rebounded and is now at or near the overall average.
| 2014 | 2015 | 2016 | 2017 | 2018 | ||||||||||||||||||||||||||||||||||||||||||||||||||||||||||||||||||||||||||||||||||||||||||||||||
|---|---|---|---|---|---|---|---|---|---|---|---|---|---|---|---|---|---|---|---|---|---|---|---|---|---|---|---|---|---|---|---|---|---|---|---|---|---|---|---|---|---|---|---|---|---|---|---|---|---|---|---|---|---|---|---|---|---|---|---|---|---|---|---|---|---|---|---|---|---|---|---|---|---|---|---|---|---|---|---|---|---|---|---|---|---|---|---|---|---|---|---|---|---|---|---|---|---|---|---|---|
| Local job market | ||||||||||||||||||||||||||||||||||||||||||||||||||||||||||||||||||||||||||||||||||||||||||||||||||||
| Good time to find a job | 39 | 39 | 44 | 42 | 46 | |||||||||||||||||||||||||||||||||||||||||||||||||||||||||||||||||||||||||||||||||||||||||||||||
| Bad time to find a job | 30 | 39 | 31 | 39 | 44 | |||||||||||||||||||||||||||||||||||||||||||||||||||||||||||||||||||||||||||||||||||||||||||||||
| Employment status | ||||||||||||||||||||||||||||||||||||||||||||||||||||||||||||||||||||||||||||||||||||||||||||||||||||
| Full time for an employer | 37 | 42 | 34 | 42 | 48 | |||||||||||||||||||||||||||||||||||||||||||||||||||||||||||||||||||||||||||||||||||||||||||||||
| Not full time for an employer | 33 | 37 | 39 | 39 | 41 | |||||||||||||||||||||||||||||||||||||||||||||||||||||||||||||||||||||||||||||||||||||||||||||||
| * % Approve | ||||||||||||||||||||||||||||||||||||||||||||||||||||||||||||||||||||||||||||||||||||||||||||||||||||
| Gallup World Poll | ||||||||||||||||||||||||||||||||||||||||||||||||||||||||||||||||||||||||||||||||||||||||||||||||||||
Among Britons who say it is a bad time to find a job in their local area, 44% now approve of EU leadership, up from 31% before the vote. Since the Brexit vote, and the regulatory uncertainty it has created, numerous companies have moved substantial numbers of jobs from the country, with more likely to follow.
At 41%, EU leadership approval among Britons who are not currently employed full time for an employer is little changed from before the Brexit vote. However, among those employed full time for an employer, approval has risen to 48%, up from 34% before the referendum.
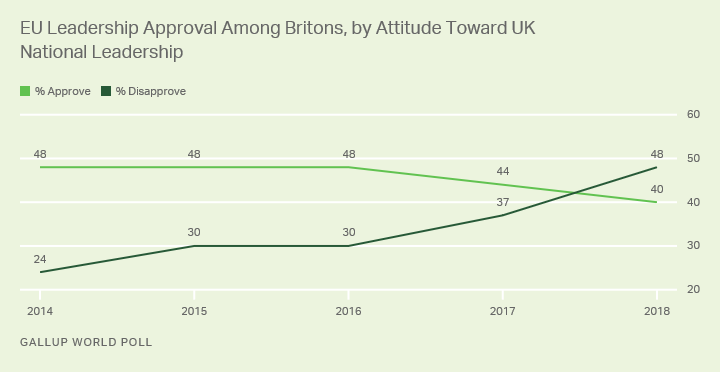
Among Britons who disapprove of their country's national leadership, approval of EU leadership is up substantially. EU leadership approval among this group now stands at 48%, up from 30% before the Brexit vote.

Implications
Britons hold the leadership of the European Union in higher esteem since the Brexit vote. While not an exact analogue for support of the EU and, likely by extension, remaining in the union, approval of EU leadership provides a reasonable barometer of sentiment in the U.K. As such, sentiment in favor of the EU has clearly improved since the vote to leave the union, and by a considerable percentage.
There have been numerous calls for a second referendum on Brexit. And given the relatively slim margin by which the measure passed (51.9% vs. 48.1%), coupled with the clearly more positive sentiment toward EU leadership, it is possible that a second referendum would result in a different outcome.
Currently improved sentiment toward EU leadership in the wake of the Brexit vote, including among many potentially disaffected segments of society that some pundits identify as responsible for the outcome of the vote, may indicate a level of buyers' remorse among the U.K. electorate. As the full implications of and political disorder that the Brexit process has created have become clear, at least some of the U.K. public who voted to leave the EU appear to have re-evaluated their attitudes toward the union.
For complete methodology and specific survey dates, please review Gallup's Country Data Set details.
Learn more about how the Gallup World Poll works.


