Story Highlights
- Personal mental health ratings remain lower than in 2015-2016
- Overall rating is still high: 83% say mental health is good or excellent
- 79% rate their physical health as good or excellent
WASHINGTON, D.C. -- Americans' assessment of their mental health slipped in 2017 and remains lower this year. Still, a huge majority (83%) say they are in "good" (40%) or "excellent" (43%) mental health. A slightly smaller percentage, 79%, describe their physical health as good (51%) or excellent (28%).

The combined total of Americans describing their mental health as good or excellent slipped four percentage points last year to 82%, a single percentage point from the 2002 low of 81%, and did not recover this year. Gallup has asked the question in each of its annual November Health and Healthcare surveys since 2001, and the combined "good" and "excellent" responses have never dropped below 82% or risen above 89% during that time. The past two years have produced two of the three lowest totals in the 18-year history of the question.
Driving the overall drop are three groups that have far more negative views of President Donald Trump, who took office two years ago, than his predecessor, Barack Obama - suggesting one possible reason for the change.
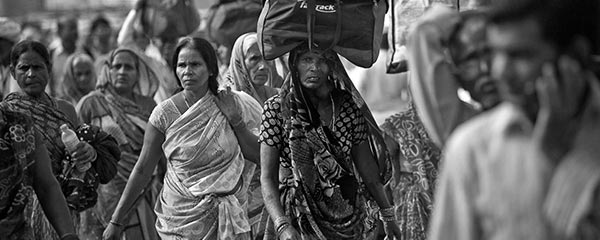
- Seventy-eight percent of Americans in low-income households (incomes less than $30,000 a year) had a positive view of their mental health (good or excellent) on average in 2015-2016, the two years before Trump was inaugurated. In the past two years, the percentage with a positive personal mental health assessment has fallen to 64%.
- Among those under the age of 35, an average of 87% gave themselves a positive mental health assessment in 2015-2016, but the number dropped to an average of 74% for the past two years.
- Democrats averaged 87% in 2015-2016. It has slid to an average of 80% for 2017-2018.
The overall percentage of Americans describing their physical health as good or excellent hit an all-time low of 76% in 2017 but bumped back up to 79% this year -- matching the totals for both 2015 and 2016. Similar to their self-assessments of their mental health, Americans' positive views of physical health have changed little over the years, ranging from 2017's low of 76% to a high of 82% in 2002.
Mental, Physical Health Both Closely Connected to Income, Education
Combined results from the past decade of polling show that Americans' assessment of their own physical and mental health can vary greatly depending on their income and their education. More than a third (38%) of those in households with annual incomes under $30,000 describe their physical health as "only fair" or "poor" compared to 9% of those in households with incomes of at least $75,000. Thirty percent of Americans who have never been to college say their physical health is only fair or poor, compared to 9% of those with postgraduate work. Differences between these groups on their assessments of their mental health are smaller, but the gaps are still significant.
| Mental health | Physical health | |||||||||||||||||||||||||||||||||||||||||||||||||||||||||||||||||||||||||||||||||||||||||||||||||||
|---|---|---|---|---|---|---|---|---|---|---|---|---|---|---|---|---|---|---|---|---|---|---|---|---|---|---|---|---|---|---|---|---|---|---|---|---|---|---|---|---|---|---|---|---|---|---|---|---|---|---|---|---|---|---|---|---|---|---|---|---|---|---|---|---|---|---|---|---|---|---|---|---|---|---|---|---|---|---|---|---|---|---|---|---|---|---|---|---|---|---|---|---|---|---|---|---|---|---|---|---|
| % Excellent/Good | % Fair/Poor | % Excellent/Good | % Fair/Poor | |||||||||||||||||||||||||||||||||||||||||||||||||||||||||||||||||||||||||||||||||||||||||||||||||
| All adults | 86 | 13 | 79 | 20 | ||||||||||||||||||||||||||||||||||||||||||||||||||||||||||||||||||||||||||||||||||||||||||||||||
| Education | ||||||||||||||||||||||||||||||||||||||||||||||||||||||||||||||||||||||||||||||||||||||||||||||||||||
| No college | 80 | 19 | 70 | 30 | ||||||||||||||||||||||||||||||||||||||||||||||||||||||||||||||||||||||||||||||||||||||||||||||||
| Some college | 88 | 11 | 81 | 18 | ||||||||||||||||||||||||||||||||||||||||||||||||||||||||||||||||||||||||||||||||||||||||||||||||
| College degree only | 91 | 9 | 89 | 11 | ||||||||||||||||||||||||||||||||||||||||||||||||||||||||||||||||||||||||||||||||||||||||||||||||
| Postgraduate work | 94 | 6 | 91 | 9 | ||||||||||||||||||||||||||||||||||||||||||||||||||||||||||||||||||||||||||||||||||||||||||||||||
| Annual household income | ||||||||||||||||||||||||||||||||||||||||||||||||||||||||||||||||||||||||||||||||||||||||||||||||||||
| Less than $30,000 | 74 | 26 | 62 | 38 | ||||||||||||||||||||||||||||||||||||||||||||||||||||||||||||||||||||||||||||||||||||||||||||||||
| $30,000-$74,999 | 88 | 12 | 82 | 18 | ||||||||||||||||||||||||||||||||||||||||||||||||||||||||||||||||||||||||||||||||||||||||||||||||
| $75,000 and above | 95 | 5 | 91 | 9 | ||||||||||||||||||||||||||||||||||||||||||||||||||||||||||||||||||||||||||||||||||||||||||||||||
| Aggregated totals from polls conducted annually 2009-2018 | ||||||||||||||||||||||||||||||||||||||||||||||||||||||||||||||||||||||||||||||||||||||||||||||||||||
| GALLUP | ||||||||||||||||||||||||||||||||||||||||||||||||||||||||||||||||||||||||||||||||||||||||||||||||||||
Other groups with 30% or more describing their physical health as only fair or poor include those who are widowed (34%), divorced (31%), retired (31%) or unemployed but looking for work (31%).
While higher levels of education and income are associated with a higher likelihood of positive assessments for both mental health and physical health, there is a split on the two types of health when considering age. Older Americans, as might be expected, are more likely to have a negative view of their physical health -- 13% of adults under 35 rate it only fair or poor, compared with 28% of those 55 and older. But older Americans are slightly less likely to report only fair or poor mental health (12%) than Americans aged 18-34 (17%).
Bottom Line
Though Americans' perceptions of their own mental health have shown a slight decline in the past two years, possibly tied to certain segments of the population's unhappiness with President Trump, they are still overwhelmingly positive overall.
However, the overall high marks the public gives itself for mental health and physical health mask some alarming numbers among specific demographic groups. High levels of negative physical health assessments can be found among the unemployed, those with less education and low-income households. The same is true for all three groups with regard to mental health, although at lower levels.
In all three cases, Americans at the opposite end of the spectrum -- those who are employed full time, those with high incomes, those with college degrees -- have low levels of negative physical and mental health assessments. Clearly, access to concrete resources, whether financial or educational, is closely connected with the ability to attain, and maintain, good physical and mental health.