Story Highlights
- Highest satisfaction with safety and relations with coworkers
- Lowest satisfaction with stress, compensation and retirement benefits
- Differences in views of men vs. women and salaried vs. hourly workers
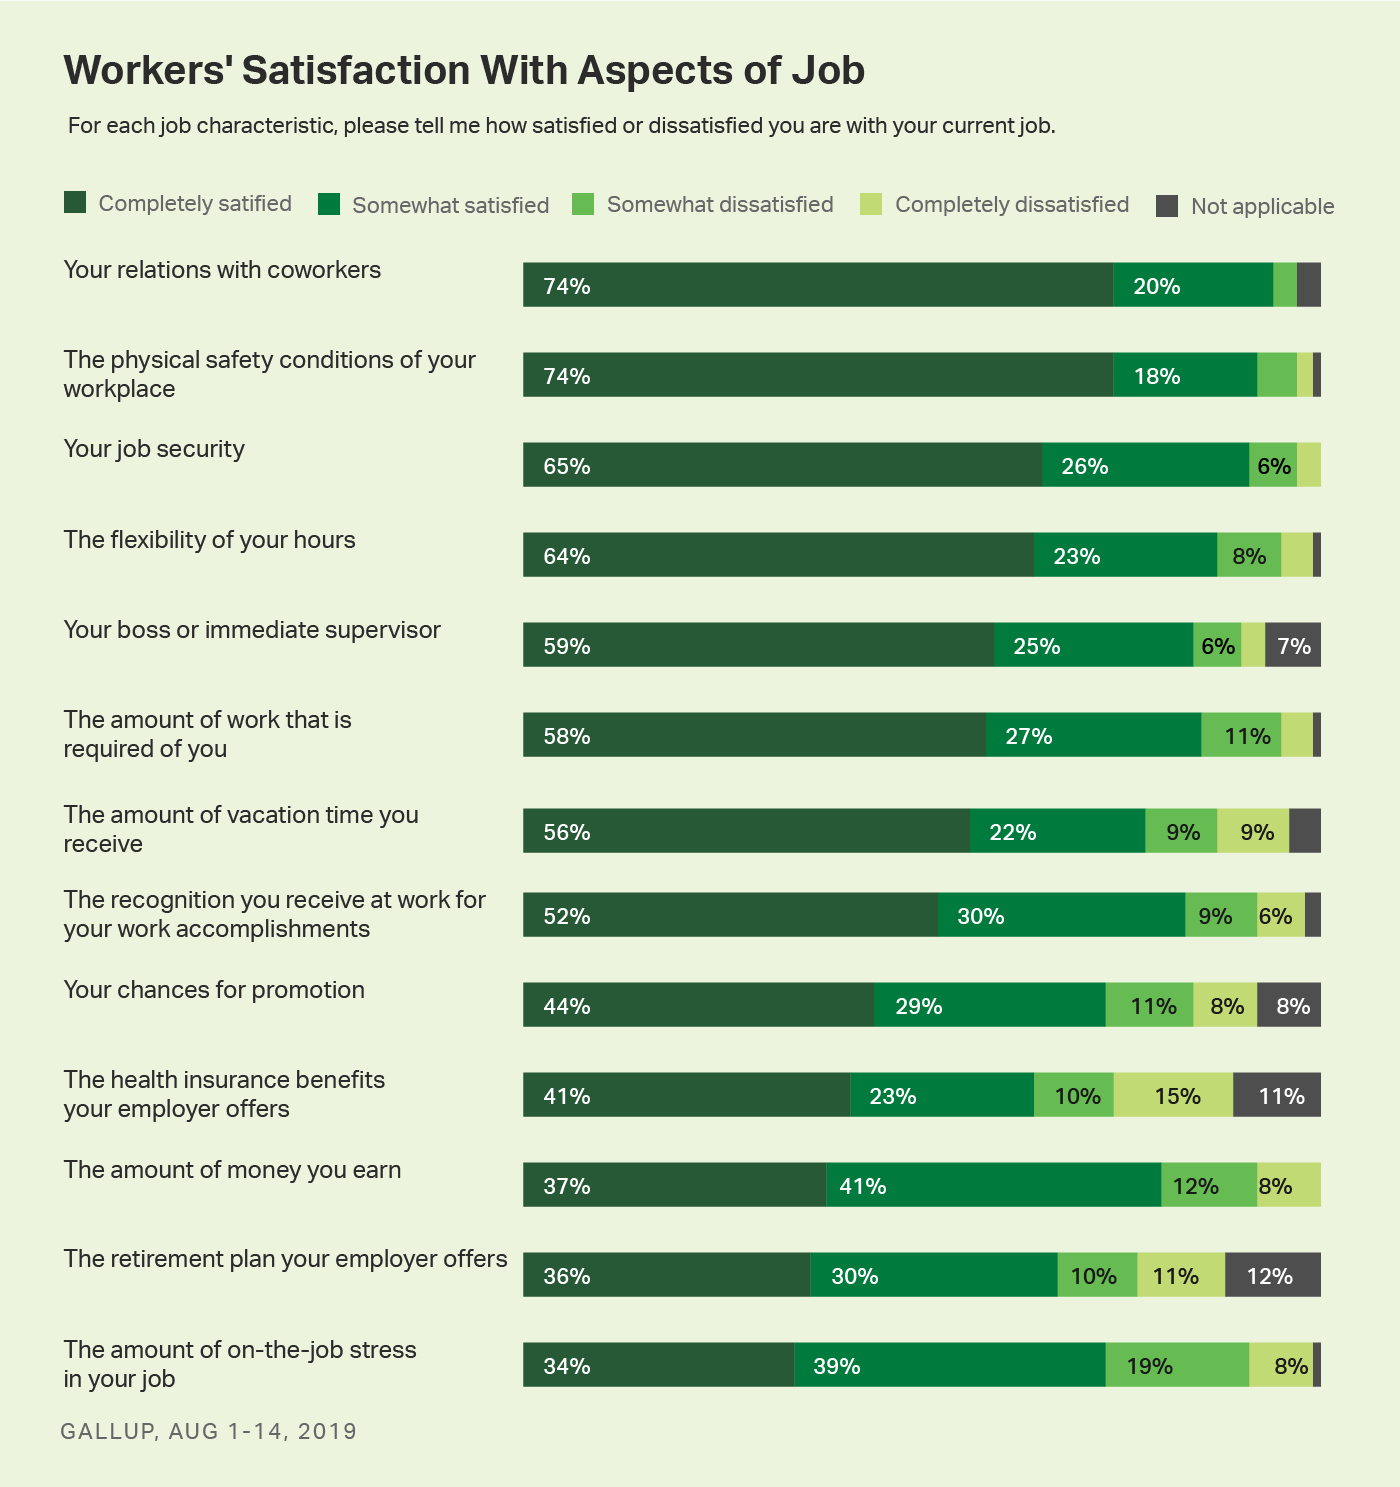
WASHINGTON, D.C. -- When asked about 13 job aspects, U.S. workers remain most satisfied with their physical safety on the job, their relations with coworkers, the flexibility of their hours and their job security. At the same time, they are least satisfied with on-the-job stress, the retirement plans offered and the money they earn.
Yet, the views of all U.S. workers are not the same. There are marked gaps in satisfaction levels between men and women and between salaried and hourly workers on several aspects.
Majorities of U.S. Workers Completely Satisfied With Eight of 13 Aspects
Gallup has been regularly measuring U.S. workers' satisfaction with all 13 of these job characteristics for two decades, and the overall rank order has been fairly stable over that time.
The latest results, from Gallup's annual Work and Education survey conducted Aug. 1-14, show that majorities of adults employed full or part time are completely satisfied with eight of the 13 job dimensions -- relations with coworkers (74%), physical safety of workplace (74%), job security (65%), flexibility of hours (64%), boss or supervisor (59%), workload (58%), amount of vacation time (56%) and recognition received for accomplishments (52%).

Workers are less satisfied with other aspects of their jobs, including their chances for promotion, health benefits, the money they earn, retirement plans and on-the-job stress -- the last of which is at the bottom of the list with 34% saying they are completely satisfied.
Gaps in Satisfaction Among Two Key Demographic Subgroups
One of the most pronounced subgroup differences in satisfaction with job characteristics is between men and women. This gender gap is greatest for six of the 13 characteristics, with men more satisfied than women for each. These include the amount of work required (12 points), physical safety at work (11 points), amount of money earned (11 points), chances for promotion (9 points), recognition for accomplishments (8 points) and retirement plan offered (8 points).
| Male | Female | Gap | |||||||||||||||||||||||||||||||||||||||||||||||||||||||||||||||||||||||||||||||||||||||||||||||||
|---|---|---|---|---|---|---|---|---|---|---|---|---|---|---|---|---|---|---|---|---|---|---|---|---|---|---|---|---|---|---|---|---|---|---|---|---|---|---|---|---|---|---|---|---|---|---|---|---|---|---|---|---|---|---|---|---|---|---|---|---|---|---|---|---|---|---|---|---|---|---|---|---|---|---|---|---|---|---|---|---|---|---|---|---|---|---|---|---|---|---|---|---|---|---|---|---|---|---|---|
| % | % | Pct. pts. | |||||||||||||||||||||||||||||||||||||||||||||||||||||||||||||||||||||||||||||||||||||||||||||||||
| The amount of work that is required of you | 63 | 51 | 12 | ||||||||||||||||||||||||||||||||||||||||||||||||||||||||||||||||||||||||||||||||||||||||||||||||
| The physical safety conditions of workplace | 79 | 68 | 11 | ||||||||||||||||||||||||||||||||||||||||||||||||||||||||||||||||||||||||||||||||||||||||||||||||
| The amount of money you earn | 42 | 31 | 11 | ||||||||||||||||||||||||||||||||||||||||||||||||||||||||||||||||||||||||||||||||||||||||||||||||
| Your chances for promotion | 48 | 39 | 9 | ||||||||||||||||||||||||||||||||||||||||||||||||||||||||||||||||||||||||||||||||||||||||||||||||
| The recognition you receive at work for your work accomplishments | 56 | 48 | 8 | ||||||||||||||||||||||||||||||||||||||||||||||||||||||||||||||||||||||||||||||||||||||||||||||||
| The retirement plan your employer offers | 40 | 32 | 8 | ||||||||||||||||||||||||||||||||||||||||||||||||||||||||||||||||||||||||||||||||||||||||||||||||
| GALLUP, Aug 1-14, 2019 | |||||||||||||||||||||||||||||||||||||||||||||||||||||||||||||||||||||||||||||||||||||||||||||||||||
The gender gap across job characteristics has not been consistent through the years. For instance, today's gender findings are markedly different from other years, like 2013, when pay was the only job characteristic that showed a significant gender gap (32% of men vs. 24% of women). Compared with then, both men and women are more satisfied with their pay, but the gap has remained. The greatest gender gap in satisfaction with compensation was 23 points in 2015 (44% of men vs. 21% of women).
The current gender gap on satisfaction with the amount of work to be done is the largest since 2001, largely owed to the record-high percentage of men who are satisfied. Likewise, the 48% of men who are completely satisfied with their chances for promotion ties the record high from 2018, and the 56% of men satisfied with their pay is near its record high.
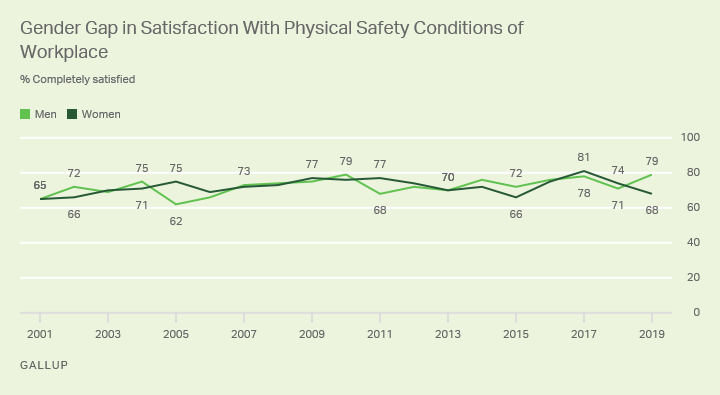
Although the current 11-point gender gap in complete satisfaction with physical safety at work is the largest since 2005, it is important to note that broad majorities of both men and women have consistently been completely satisfied with their safety.

The drop in women's satisfaction with their safety at work -- from 81% complete satisfaction in 2017 to 68% now -- may have resulted from the rise of the #MeToo movement in the U.S. Other Gallup research has found that the #MeToo movement, which shined a light on sexual harassment of women in the workplace, has resulted in more women saying they worry about being the victim of sexual assault.
In addition to a disparity in views between men and women, there are also meaningful differences between salaried and hourly workers' satisfaction levels. In general, hourly workers are less satisfied than salaried workers with benefits and compensation as well as receiving recognition for work accomplishments. These findings are consistent with past readings, although Gallup has not included the question about hourly vs. salary pay in all of its surveys dating back to 2001.
| Salaried | Hourly | Gap | |||||||||||||||||||||||||||||||||||||||||||||||||||||||||||||||||||||||||||||||||||||||||||||||||
|---|---|---|---|---|---|---|---|---|---|---|---|---|---|---|---|---|---|---|---|---|---|---|---|---|---|---|---|---|---|---|---|---|---|---|---|---|---|---|---|---|---|---|---|---|---|---|---|---|---|---|---|---|---|---|---|---|---|---|---|---|---|---|---|---|---|---|---|---|---|---|---|---|---|---|---|---|---|---|---|---|---|---|---|---|---|---|---|---|---|---|---|---|---|---|---|---|---|---|---|
| % | % | Pct. pts. | |||||||||||||||||||||||||||||||||||||||||||||||||||||||||||||||||||||||||||||||||||||||||||||||||
| The amount of vacation time you receive | 68 | 47 | 21 | ||||||||||||||||||||||||||||||||||||||||||||||||||||||||||||||||||||||||||||||||||||||||||||||||
| The health insurance benefits your employer offers | 50 | 38 | 12 | ||||||||||||||||||||||||||||||||||||||||||||||||||||||||||||||||||||||||||||||||||||||||||||||||
| The retirement plan your employer offers | 44 | 32 | 12 | ||||||||||||||||||||||||||||||||||||||||||||||||||||||||||||||||||||||||||||||||||||||||||||||||
| The recognition you receive at work for accomplishments | 56 | 47 | 9 | ||||||||||||||||||||||||||||||||||||||||||||||||||||||||||||||||||||||||||||||||||||||||||||||||
| The amount of money you earn | 41 | 33 | 8 | ||||||||||||||||||||||||||||||||||||||||||||||||||||||||||||||||||||||||||||||||||||||||||||||||
| GALLUP, Aug 1-14, 2019 | |||||||||||||||||||||||||||||||||||||||||||||||||||||||||||||||||||||||||||||||||||||||||||||||||||
The largest gap in satisfaction between hourly and salaried employees is on vacation time (21 points). Health insurance benefits (12 points), retirement plan (12 points), recognition for work accomplishments (9 points) and pay (8 points) are the other areas of greatest disparity. Less than half of hourly workers are completely satisfied with each of these aspects.
Slim Majority of Full-Time Workers Spend More Than 40 Hours a Week Working
Although a 40-hour workweek is widely regarded as the standard for full-time employment, just 40% of full-time workers say they work precisely this much and 52% of adults employed full time in the U.S. report working more than 40 hours per week, including 39% who work at least 50 hours weekly. Only 8% of full-time employees report working less than 40 hours.
| Hours worked | |||||||||||||||||||||||||||||||||||||||||||||||||||||||||||||||||||||||||||||||||||||||||||||||||||
|---|---|---|---|---|---|---|---|---|---|---|---|---|---|---|---|---|---|---|---|---|---|---|---|---|---|---|---|---|---|---|---|---|---|---|---|---|---|---|---|---|---|---|---|---|---|---|---|---|---|---|---|---|---|---|---|---|---|---|---|---|---|---|---|---|---|---|---|---|---|---|---|---|---|---|---|---|---|---|---|---|---|---|---|---|---|---|---|---|---|---|---|---|---|---|---|---|---|---|---|
| % | |||||||||||||||||||||||||||||||||||||||||||||||||||||||||||||||||||||||||||||||||||||||||||||||||||
| 70+ hours | 7 | ||||||||||||||||||||||||||||||||||||||||||||||||||||||||||||||||||||||||||||||||||||||||||||||||||
| 60-69 hours | 11 | ||||||||||||||||||||||||||||||||||||||||||||||||||||||||||||||||||||||||||||||||||||||||||||||||||
| 50-59 hours | 21 | ||||||||||||||||||||||||||||||||||||||||||||||||||||||||||||||||||||||||||||||||||||||||||||||||||
| 41-49 hours | 13 | ||||||||||||||||||||||||||||||||||||||||||||||||||||||||||||||||||||||||||||||||||||||||||||||||||
| 40 hours | 40 | ||||||||||||||||||||||||||||||||||||||||||||||||||||||||||||||||||||||||||||||||||||||||||||||||||
| Less than 40 hours | 8 | ||||||||||||||||||||||||||||||||||||||||||||||||||||||||||||||||||||||||||||||||||||||||||||||||||
| GALLUP, Aug 1-14, 2019 | |||||||||||||||||||||||||||||||||||||||||||||||||||||||||||||||||||||||||||||||||||||||||||||||||||
The substantial proportion of full-time workers who say they typically log more than 40 hours each week pushes the average number of hours worked up to 47.
Implications
American workers are at least somewhat satisfied with all 13 characteristics of their jobs measured by Gallup, but the percentage who are completely satisfied varies greatly from 34% for work-related stress to 74% for co-worker relations and job safety. The latest rankings are similar to previous readings.
Gallup's vast body of research about employee engagement explores how to make employees more content and productive in their jobs. Specifically, Gallup's State of the American Workplace report finds that only 30% of American workers are engaged at work. Although they are broadly satisfied with their relations with coworkers, job security, boss, flexibility in hours and workload, this does not necessarily mean they are engaged employees.
View complete question responses and trends.
Learn more about how the Gallup Poll Social Series works.


