
Story Highlights
- Approval rating for congressional Democrats is 38%; Republicans at 34%
- About four in 10 in U.S. have favorable opinions of Trump, Pence, Pelosi
- 27% view Mitch McConnell favorably
WASHINGTON, D.C. -- As events continue to unfold in the House Democrats' impeachment inquiry into President Donald Trump's dealings with Ukraine, 38% of Americans approve of the job congressional Democrats are doing. Republicans in Congress earn a slightly lower approval of 34%.
These readings are in line with the lukewarm approval ratings each group received in January, around the time of the government shutdown. Today, as then, equal proportions of Republicans and Democrats praise the job their own party's members of Congress are doing, while offering equally negative ratings of the opposing party's members.
The public is also largely underwhelmed by some of the key players in the impeachment inquiry, including Trump, Vice President Mike Pence, Speaker of the U.S. House of Representatives Nancy Pelosi, and Senate Republican Leader Mitch McConnell.
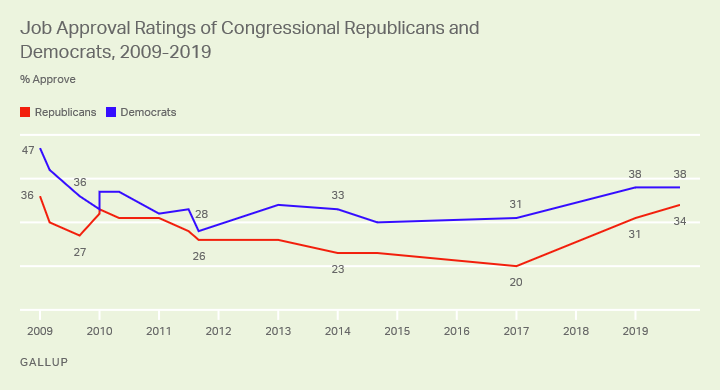
Approval Ratings of Congressional Republicans and Democrats
Gallup has been periodically tracking separate approval ratings for Republicans and Democrats in Congress since 1999. The latest readings, from an Oct. 14-31 poll, are close to the averages since 1999 of 35% for Republicans and 41% for Democrats.
Partisans' views of both their own party's performance in Congress and the opposing party's performance are sharply polarized and similar. Congressional Republicans' approval rating is 63% among rank-and-file Republicans and Republican-leaning independents and 13% among Democrats and Democratic-leaning independents. Meanwhile, approval of congressional Democrats is 64% among Democrats and 8% among Republicans.
| Approve of Republicans in Congress | Approve of Democrats in Congress | ||||||||||||||||||||||||||||||||||||||||||||||||||||||||||||||||||||||||||||||||||||||||||||||||||
|---|---|---|---|---|---|---|---|---|---|---|---|---|---|---|---|---|---|---|---|---|---|---|---|---|---|---|---|---|---|---|---|---|---|---|---|---|---|---|---|---|---|---|---|---|---|---|---|---|---|---|---|---|---|---|---|---|---|---|---|---|---|---|---|---|---|---|---|---|---|---|---|---|---|---|---|---|---|---|---|---|---|---|---|---|---|---|---|---|---|---|---|---|---|---|---|---|---|---|---|
| % | % | ||||||||||||||||||||||||||||||||||||||||||||||||||||||||||||||||||||||||||||||||||||||||||||||||||
| U.S. adults | 34 | 38 | |||||||||||||||||||||||||||||||||||||||||||||||||||||||||||||||||||||||||||||||||||||||||||||||||
| Republicans/Republican leaners | 63 | 8 | |||||||||||||||||||||||||||||||||||||||||||||||||||||||||||||||||||||||||||||||||||||||||||||||||
| Democrats/Democratic leaners | 13 | 64 | |||||||||||||||||||||||||||||||||||||||||||||||||||||||||||||||||||||||||||||||||||||||||||||||||
| GALLUP, Oct. 14-31, 2019 | |||||||||||||||||||||||||||||||||||||||||||||||||||||||||||||||||||||||||||||||||||||||||||||||||||
The latest readings are nearly identical to January's readings. However, both parties are rated better now than in September 2017, after Republicans failed to repeal the Affordable Care Act. Then, just 20% approved of the Republicans in Congress -- the lowest rating for any party in Gallup's trend -- and 31% approved of the Democrats in Congress.
Overall approval of Congress had been at or below 20% for months until early October, when it hit 25% as Democrats' and independents' ratings of Congress rose, coinciding with the start of the impeachment inquiry. Partisans tend to rate their own parties in Congress more positively than they do Congress overall.
Americans' Views of Political Leaders
On balance, each of the four political leaders measured in the latest survey is viewed more negatively than positively. Their net image ratings -- the difference between favorable and unfavorable views of each -- differ significantly. Pence's -5 net favorability rating is slightly better than Pelosi's -10 rating, while Trump's -18 and McConnell's -19 are similar to each other.
Roughly four in 10 Americans hold favorable views of the president, vice president and speaker of the House, while the Senate Republican leader's favorability rating is an even lower 27%, though he is also the least known of the four.
| Donald Trump | Mike Pence | Nancy Pelosi | Mitch McConnell | |||||||||||||||||||||||||||||||||||||||||||||||||||||||||||||||||||||||||||||||||||||||||||||||||
|---|---|---|---|---|---|---|---|---|---|---|---|---|---|---|---|---|---|---|---|---|---|---|---|---|---|---|---|---|---|---|---|---|---|---|---|---|---|---|---|---|---|---|---|---|---|---|---|---|---|---|---|---|---|---|---|---|---|---|---|---|---|---|---|---|---|---|---|---|---|---|---|---|---|---|---|---|---|---|---|---|---|---|---|---|---|---|---|---|---|---|---|---|---|---|---|---|---|---|---|---|
| % | % | % | % | |||||||||||||||||||||||||||||||||||||||||||||||||||||||||||||||||||||||||||||||||||||||||||||||||
| U.S. adults | ||||||||||||||||||||||||||||||||||||||||||||||||||||||||||||||||||||||||||||||||||||||||||||||||||||
| Favorable | 41 | 39 | 40 | 27 | ||||||||||||||||||||||||||||||||||||||||||||||||||||||||||||||||||||||||||||||||||||||||||||||||
| Unfavorable | 59 | 44 | 50 | 46 | ||||||||||||||||||||||||||||||||||||||||||||||||||||||||||||||||||||||||||||||||||||||||||||||||
| No opinion | 1 | 16 | 10 | 28 | ||||||||||||||||||||||||||||||||||||||||||||||||||||||||||||||||||||||||||||||||||||||||||||||||
| Republicans/Republican leaners | ||||||||||||||||||||||||||||||||||||||||||||||||||||||||||||||||||||||||||||||||||||||||||||||||||||
| Favorable | 84 | 71 | 8 | 47 | ||||||||||||||||||||||||||||||||||||||||||||||||||||||||||||||||||||||||||||||||||||||||||||||||
| Unfavorable | 16 | 16 | 87 | 29 | ||||||||||||||||||||||||||||||||||||||||||||||||||||||||||||||||||||||||||||||||||||||||||||||||
| No opinion | * | 13 | 5 | 24 | ||||||||||||||||||||||||||||||||||||||||||||||||||||||||||||||||||||||||||||||||||||||||||||||||
| Democrats/Democratic leaners | ||||||||||||||||||||||||||||||||||||||||||||||||||||||||||||||||||||||||||||||||||||||||||||||||||||
| Favorable | 7 | 15 | 67 | 11 | ||||||||||||||||||||||||||||||||||||||||||||||||||||||||||||||||||||||||||||||||||||||||||||||||
| Unfavorable | 93 | 68 | 20 | 61 | ||||||||||||||||||||||||||||||||||||||||||||||||||||||||||||||||||||||||||||||||||||||||||||||||
| No opinion | * | 18 | 13 | 27 | ||||||||||||||||||||||||||||||||||||||||||||||||||||||||||||||||||||||||||||||||||||||||||||||||
| * Less than 0.5% | ||||||||||||||||||||||||||||||||||||||||||||||||||||||||||||||||||||||||||||||||||||||||||||||||||||
| GALLUP, Oct. 14-31, 2019 | ||||||||||||||||||||||||||||||||||||||||||||||||||||||||||||||||||||||||||||||||||||||||||||||||||||
Since 1999, when Gallup began measuring Trump's favorability rating, it has never been above 50% among all Americans. His current -18 net rating is about the same as it was during last winter's federal government shutdown, after which it rose to -2 in April. The latest net rating is not near his worst (-37 during the 2016 campaign).
Pelosi's average favorability rating for her first term in 2007-2011 and her second term, which began in January, is 37%. Her overall net favorability is -9, which is similar to that of John Boehner, who left office with an average -12 net rating; Paul Ryan's average net rating was +3.
Looking at partisans' views, majorities of Republicans have a favorable opinion of Trump (84%) and Pence (71%), and 67% of Democrats view Pelosi favorably. Meanwhile, McConnell's favorability rating among his own party's base is 47%, while 29% of Republicans have an unfavorable opinion of him.
View complete question responses and trends.
Learn more about how the Gallup Poll Social Series works.